Click on the image to zoom. Then click your browser back button to return to reading the post.
Intro
This is a response to the [CALL] Reddit DataViz Battle JAN2018: Visualize the Growth Rates of Algae:
http://community.wolfram.com/groups/-/m/t/1257547
Details
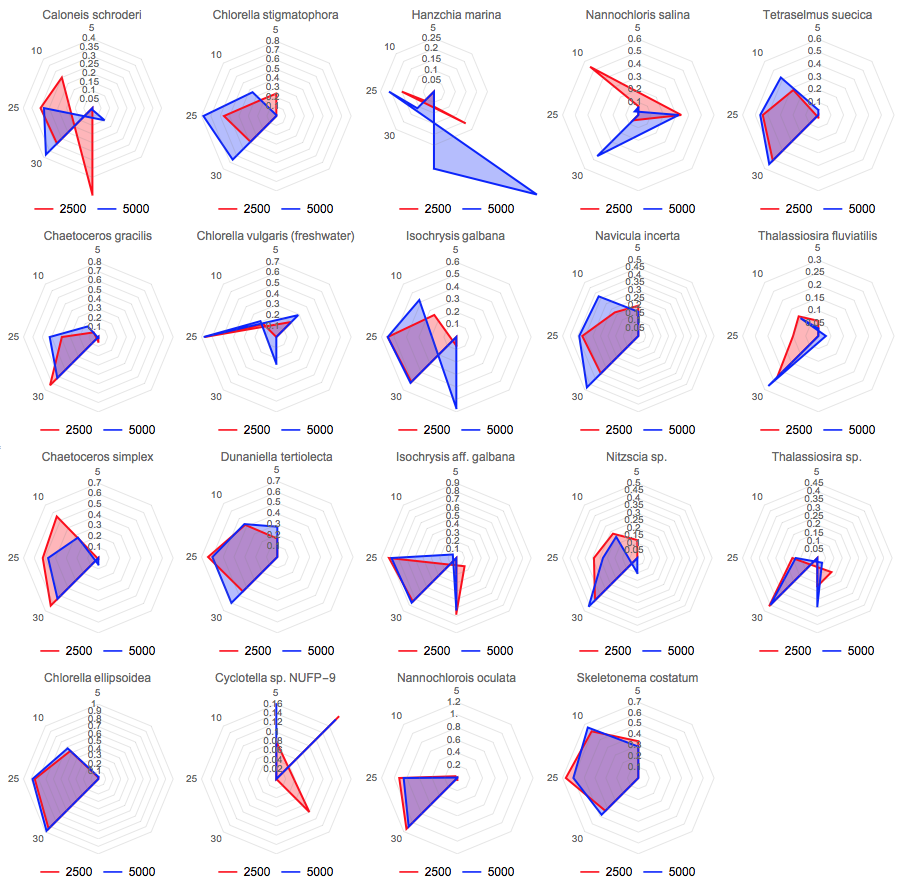
I was thinking about applying the RadarChart package too, as in here, but I thought it would be better if for each specie there is a separate radar chart.
sdata = MapThread[
Prepend, {Transpose[
SortBy[Transpose[Rest /@ data], {#[[2]], #[[1]]} &]],
First /@ data}];
Multicolumn[Map[
RadarChart[{Join[#[[2 ;; 5]], {0, 0, 0, 0}],
Join[#[[6 ;; -1]], {0, 0, 0, 0}]}, PlotLabel -> #[[1]],
Filling -> Axis, AxesLabel -> sdata[[1, 2 ;; 5]],
PlotStyle -> {Red, Blue},
ChartLegends -> {sdata[[2, 2]], sdata[[2, 6]]}] &,
sdata[[3 ;; -1]]], 5]
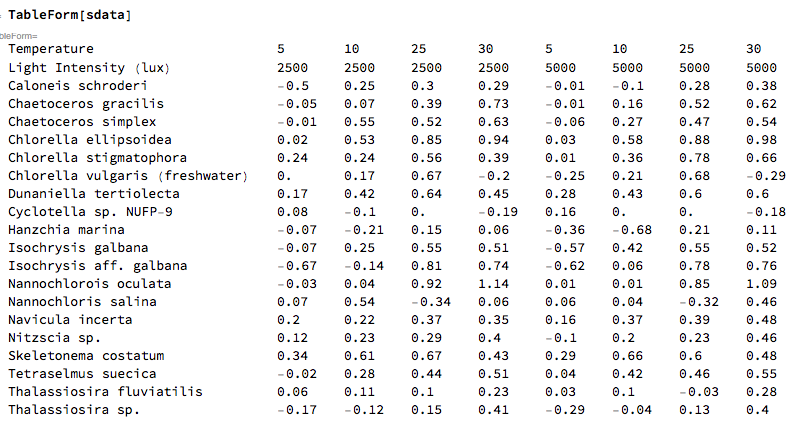
TableForm[sdata]