Here are some comments:
i) this is a fifth order polynomial and has 5 solutions (in the complex numbers).
Reduce[x^5 - (a^2 + 4) x^3 + x^2 + a^2 x + 2 a + 1 == 0, x]

ii) I suppose you are looking for real solutions?
What about this:
sols = Table[{b, Length[x /. Normal[Solve[x \[Element] Reals && x^5 - (a^2 + 4) x^3 + x^2 + a^2 x + 2 a + 1 == 0 /. a -> b, x]]]}, {b, -5, 5, 0.01}];
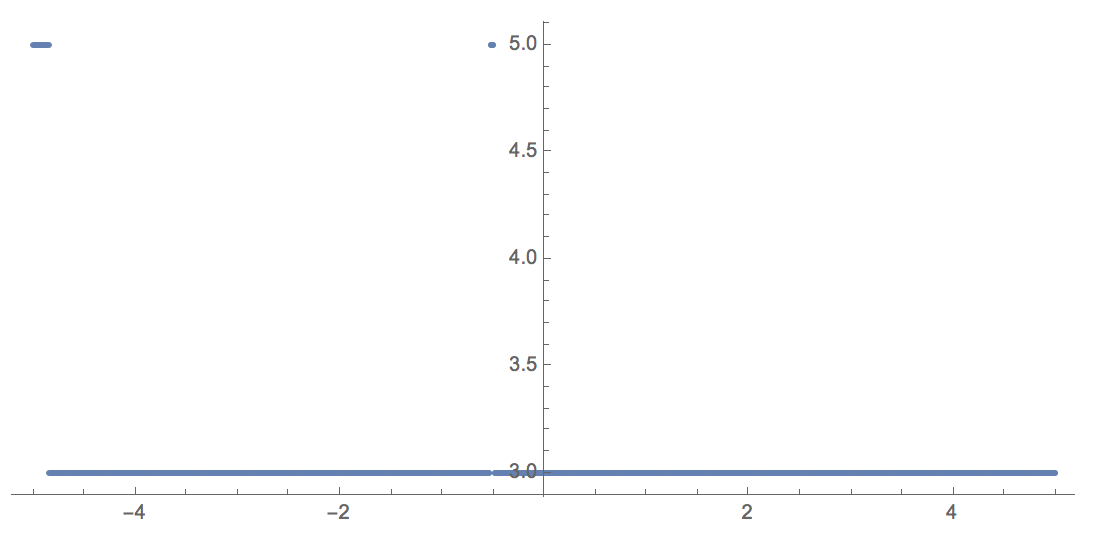
iii) Of course, there are lots of ways of getting this:
Table[{b, Length[Select[x /. Normal[Solve[x^5 - (a^2 + 4) x^3 + x^2 + a^2 x + 2 a + 1 == 0 /. a -> b, x]], Im[#] == 0 &]]}, {b, -5, 5, 0.001}]
Alternatively, you can work with Reduce.
Cheers,
Marco


