Message Boards Message Boards

0
|
2933 Views
|
3 Replies
|
0 Total Likes
View groups...
Share
Share this post:
GROUPS:

Help for a trajectory algorithm

Posted 11 years ago
Anyone can help me with an algorithm? I do not know if exist there something like that...
In the image each color represents a trajectory


And I want transform this into a simple and smooth trajectory, like the red points on next image.


Any help? Thanks
POSTED BY: Bruno Galveia
3 Replies
Bruno, you can also conveniently change the length of the list of elements you want to test through with Manipulate function. Simply replace the second argument in the ListPlot function with a dynamic variable "k" and wrap it with the Manipulate function (k is from 5 to 100 with step lenght = 1): 

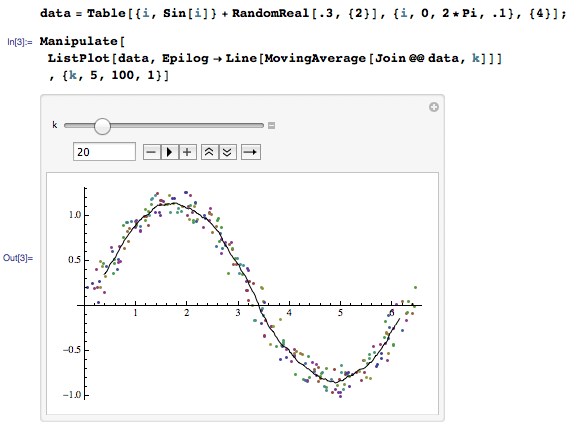
Now you can customize how smooth the data should be. 
Copiable code:
data=Table[{i,Sin[i]}+RandomReal[.3,{2}],{i,0,2*Pi,.1},{4}];
Manipulate[
ListPlot[data,Epilog->Line[MovingAverage[Join@@data,k]]]
,{k,5,100,1}]
POSTED BY: Shenghui Yang
Posted 11 years ago
Thanks, nice help! ;-)
POSTED BY: Bruno Galveia
One simple way would be to calculate a moving average:
data = Table[{i, Sin[i]} + RandomReal[.3, {2}], {i, 0, 2*Pi, .1}, {4}];

ListPlot[data, Epilog -> Line[MovingAverage[Join @@ data, 50]]]
POSTED BY: Arnoud Buzing
Reply to this discussion
Community posts can be styled and formatted using the Markdown syntax.
Reply Preview
Attachments
Remove
or Discard

Group Abstract Group Abstract