Message Boards Message Boards

Find the contour of a pair of multi-variable functions?

Posted 6 years ago

I have two functions f[x,y,z,a,b] and g[x,y,z,a,b], where the variables are restricted to a set of values: x ? [x0, x1], y ? [y0, y1], z ? [z0, z1], a ? [a0, a1], b ? [b0, b1]. I can find the minimum and maximum values within the restrictions using Minimize and Maximize.

These two functions are the X and Y coordinates of a point, I am using them to show some paths using ParametricPlot and to draw graphics using Graphics. The thing is, I need to know the boundaries which define the possible locations of the point.

How could I find the contour of the area for which the (X,Y) plot of these two functions is defined?

I have been trying to use ParametricRegion, but it takes an awful lot of time to give the results with 2/5 variables. It is kind of strange that using ParametricPlot with 2 variables is much faster than ParametricRegion with the same 2 variables.

POSTED BY: JOSE OLIVER
7 Replies
Posted 6 years ago

I have tried to do it in two different ways.

1. Using ParametricRegion:

R = ParametricRegion[{Xt[X2, Th3, La1, La2, La3, La4, La5] /. {X2 -> X2in, La3 -> La3in} /. {Th3 -> Th3in, La4 -> La4in, La5 -> La5in}, Yt[X2, Th3, La1, La2, La3, La4, La5] /. {X2 -> X2in, La3 -> La3in} /. {Th3 -> Th3in, La4 -> La4in, La5 -> La5in}}, {{La1, dA1min, dA1max}, {La2, dA2min, dA2max}}];

And trying to represent it by:

Region[R]

This is not able to give a result (it is still running after about 10h and 8GB of RAM).

2. Using ParametricPlot

ParametricPlot[{{Xt[X2, Th3, La1, La2, La3, La4, La5], Yt[X2, Th3, La1, La2, La3, La4, La5]}} /. {X2 -> X2min, Th3 -> Th3min, La3 -> dA3min, La4 -> dA4min, La5 -> dA5min}, {La1, dA1min, dA1max}, {La2, dA2min, dA2max}, AspectRatio -> Automatic]

This is able to give a result relatively fast (40s and <2GB of RAM).

Parametric Plot

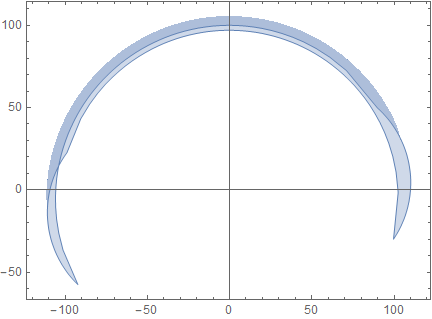
But unfortunately, ParametricPlot can't plot regions depending on more than 2 variables.

Just to give some insight into the problem, (Xt, Yt) give the position of a point from a body in a machine. I need to obtain the 'range of action' of this point. I need to find the contour of the area (or the area itself) in which the point can be located. The problem is that the point depends on 5 (6) variables.

POSTED BY: JOSE OLIVER

You may choose a finite grid in your 5 or 6-dimensional cuboid, calculate the corresponding points in the plane and visualize it as a cloud of points. This may give some insight into the shape of your region.

POSTED BY: Gianluca Gorni

It is suggested that you post any code you have already written so your problem can be examined more closely.

POSTED BY: Moderation Team
Posted 6 years ago

I guess the way to go is trying to get a discrete representation as a cloud of points, I was hoping to be able to get a complete region.

Going back to the ParametricPlot output, what do the different shades of blue mean?

Parametric Plot

EDIT:

The dark blue region is the place where different combinations of parameter values give the same (X,Y) combination. Maybe this superposition of points is the reason why ParametricRegion is not able to give an output.

POSTED BY: JOSE OLIVER

I assume it is an overlap.

POSTED BY: Gianluca Gorni
Posted 6 years ago

I have more or less found the solution to this: plotting variables in pairs with the correct choice of maximum and minimum values and overlapping them.

The output is:

enter image description here

Once checked that this visual representation covers the whole region, it is now possible to identify the curves that define the edges and draw only them.

POSTED BY: JOSE OLIVER

As mentioned by the Moderation Team, it is difficult to offer assistance in the absence of a concrete example.

POSTED BY: Daniel Lichtblau
Reply to this discussion
Community posts can be styled and formatted using the Markdown syntax.
Reply Preview
Attachments
Remove
or Discard

Group Abstract Group Abstract