It is an interesting topic for computational exploration Swede, I did a little 60 minute riff from your prompt and came up with something that I think points in an interesting direction of 3D visualization of Earthquake data - although it needs some beautification and better scaling. If I had some more time I would use the map of Hawaii as a texture and apply it to the BSplineSurface[] of the islands' GeoElevationData[], but alas other duties call.
This reminds me how fun Wolfram Language is for exploring the world around me. It is pretty darn cool that EarthquakeData[] seems to be pulling data nearly as fast as it is being reported. I made this so it pulls the last three days worth of earthquake data, but this could easily be spun into a FormPage[] that lets people explore the region during any time period they want.
And of course, lots of compassion to those being affected by the recent volcanic activity!
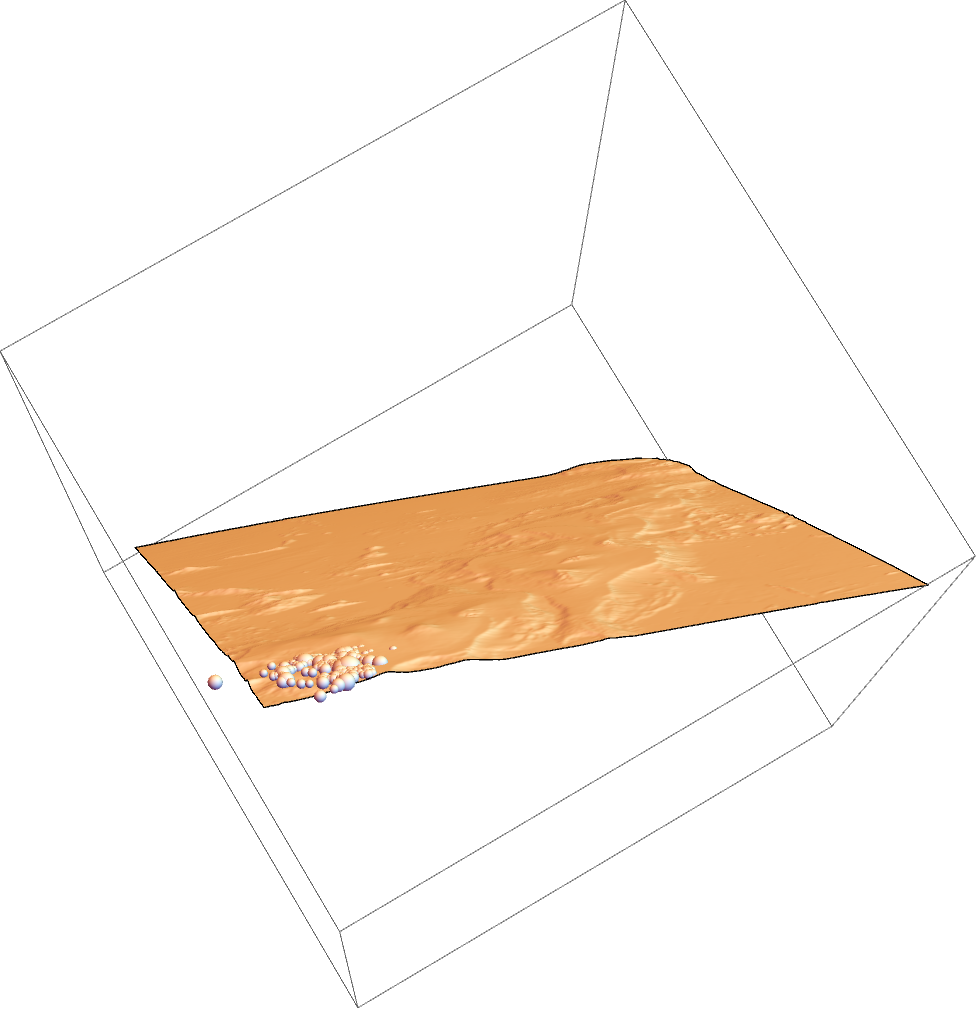
Here is the output of my exploration, it is a 3D topographical map of the Hawaiian Islands along with a bubble for each earthquake - radius of each bubble is determined by the magnitude of the quake:
Here is how I got there (notebook attached for those that want it)...
pull data from last three days about earthquake activity near the big island
data=EarthquakeData[ Entity["Island", "HawaiiIsland"], 2, {DatePlus[Now,{-3,"Days"}],Now}];
Do some cleaning, could be done more tersely using Query[], but I am old school in some ways
simpleData=Values/@data[[All,{"Period","Magnitude","Position","Depth"}]];

simpleXYZ = MapAt[First@GeoPositionXYZ@# &, simpleData, {All, 3}];

simpleXYZ=Values@MapAt[QuantityMagnitude@#&,simpleXYZ,{All,4}];
Make the visuals for the events (could have done something clever with "Depth", but ran out of time).
vizMe=Map[Function[Ball[#[[3]],#[[2]] 10^3]],simpleXYZ];
Next, I make a 3D plot of Hawaii's elevation
elevation =
  First@GeoElevationData[Entity["AdministrativeDivision", {"Hawaii", "UnitedStates"}],  Automatic, "GeoPositionXYZ", UnitSystem -> "Metric"];

surface = BSplineSurface@elevation;
and voila, you can see a simple map of all the Earthquakes
Graphics3D[{surface, vizMe}]
 Attachments:


