Message Boards Message Boards

How to create a drawing pad in Mathematica?

I would like to create a Mathematica program that allows one to make a line drawing using a mouse. I know Mathematca provides Graphis Tools for just this puprose, but I neeed to know how to do just the basic drawing using Mathematica commands. The best that I can come up with on my own is
Module[{n, A, a, p},
n = 0; A = Array[a, 1000];
Manipulate[(n++; A[[n]] = p;
   ListLinePlot[A,
    PlotRange -> {{-10, 10}, {-10, 10}}]), {{p, {0, 0}}, Locator}]]
Although this works, it does not work very well. For example, the drawing process is jerky, and if I finish a small drawing and then try to export it:
Export["drawing.pdf", %]
it usually fails to capture the drawing. Also, it is not long before the array A exceeds its bounds. Surely there is a better way! I would be grateful for any suggestions.
7 Replies
Posted 12 years ago
DynamicModule[{p = {}, l = {}},
EventHandler[
  Dynamic@Graphics[{Point[p], l}, PlotRange -> 1, Frame -> True],
{{"MouseClicked", 1} :> (AppendTo[p, MousePosition["Graphics"]]; If[Length[p] >= 2, l = Line[p]]),
  {"MouseDragged", 1} :> Export["drawing.pdf", Dynamic@Graphics[{Point[p], l}, PlotRange->1, Frame->True], PlotRange->1, Frame->True]}]]

If you look at the EventHandler help page and click on Applications then you can see where this came from. Without that example to start hacking this would never have been possible. Instead of fitting a line through the points this draws line segments connecting the points. Position your mouse and give it a left click to add a point to the page.

One difficulty is to get it to stop adding points and export the image. The help page claims you can capture keystrokes. I tried and failed, Google searches seem to say that others have done the same. So my trick to export is to use the left mouse button to press-drag-release and your file should appear.  Finding the correct argument for Export took some experimentation.
POSTED BY: Bill Simpson
Thanks Bill. Your example draws straight line between clicked points. However I need continuous curves made with a dragged mouse (Plot Pen Down in an old forgotten technology). Can I easily adapt your example to do this?
This has been done already at Demonstration project. You can download notebook with the source code at the link below, but I also give it here - it is not that big.

Spline Sketchpad, by Yu-Sung Chang
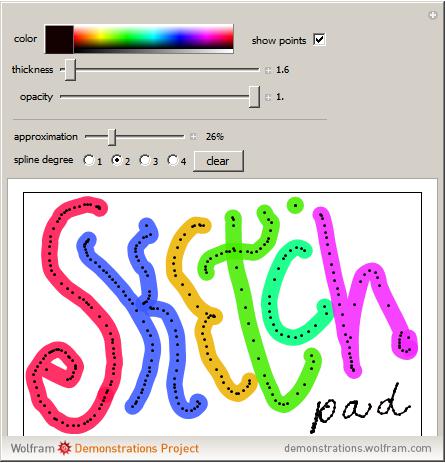


 Manipulate[
  If[(prevdegree =!= degree) || (prevapprox =!= approx),
   degree = If[approx < 20, Min[degree, 2], degree];
   ctrlpts =
    Table[splineFit[p,
      Max[{Floor[(1 - approx/100) Length[p]], degree + 1}],
      degree], {p, pts}]; prevdegree = degree; prevapprox = approx];
  EventHandler[
   Graphics[{
    CapForm["Round"], JoinForm["Round"],
    If[ctrlpts =!= {},
     MapThread[{#1, Opacity[#2], AbsoluteThickness[#3],
        BSplineCurve[#4, SplineDegree -> degree]} &, {colorlist,
       opacitylist, thicknesslist, ctrlpts}], {}],
    If[down && pts =!= {}, {color, Opacity[opacity],
      AbsolutePointSize[thickness], Point[Last[pts]]}, {}],
    If[pen && pts =!= {},
     If[down, Point /@ Most[pts], Point /@ pts], {}]
    },
   PlotRange -> 1, ImageSize -> 400, AspectRatio -> 1/GoldenRatio,
   Frame -> True, FrameTicks -> False],
  {"MouseDown" :> (AppendTo[pts, {MousePosition["Graphics"]}];
     down = True),
   "MouseMoved" :> (If[down,
      AppendTo[pts[[count]], MousePosition["Graphics"]]]),
   "MouseUp" :> (down = False; count++;
     ctrlpts =
      Table[splineFit[p,
        Max[{Floor[(1 - approx/100) Length[p]], degree + 1}],
        degree], {p, pts}]; AppendTo[colorlist, color];
     AppendTo[opacitylist, opacity];
     AppendTo[thicknesslist, thickness])}
  ],
(* Pen controls *)

Row[{Control[{color, Blue}],
   Control[{{pen, False, "show points"}, {True, False}}]}, Spacer[10]],
{{thickness, 4}, 1, 20, Appearance -> "Labeled", ImageSize -> Medium},
{{opacity, 1}, 0, 1, Appearance -> "Labeled", ImageSize -> Medium},
Delimiter,
(* Spline controls *)

Row[{Control[{{approx, 30, "approximation"}, 0, 100, 1,
     ImageSize -> Small}], Spacer[10], Dynamic[approx], "%"}],
Row[{Control[{{degree, 2,
      "spline degree"}, (Dynamic[
        If[approx < 20, RadioButtonBar[Dynamic[degree], {1, 2}],
         RadioButtonBar[Dynamic[degree], {1, 2, 3, 4}]]] &)}],
   Control[{{dummy, "", ""},
     Button["clear",
       colorlist = opacitylist = thicknesslist = pts = ctrlpts = {};
       down = False; count = 1, ImageSize -> 50] &}]}],
(* Dummies *)
{{colorlist, {}}, ControlType -> None},
{{thicknesslist, {}}, ControlType -> None},
{{opacitylist, {}}, ControlType -> None},
{{prevapprox, 0}, ControlType -> None},
{{prevdegree, 2}, ControlType -> None},
{{pts, {}}, ControlType -> None},
{{ctrlpts, {}}, ControlType -> None},
{{down, False}, ControlType -> None},
{{count, 1}, ControlType -> None},
AutorunSequencing -> {2, 5},
Initialization :> (
   splineFit[pts_, n_, d_] := Module[{uparam, knots, basis},
      If[Length[pts] == 1, Return[Join[pts, pts]]];
      If[Length[pts] <= d, Return[pts]];
      (*uparam=With[{acc=N[Accumulate[Norm/@pts]]},(acc-First[
      acc])/(Last[acc]-First[acc])];*)
      
      uparam = N[Range[0, 1, 1/(Length[pts] - 1)]];
      knots =
       Join[ConstantArray[0, d], Range[0, 1, 1/(n - d)],
        ConstantArray[1, d]];
      basis =
       Table[BSplineBasis[{d, knots}, j - 1, uparam[[i]]], {i,
         Length[uparam]}, {j, n}];
      LeastSquares[basis, pts]];
   )
]
POSTED BY: Vitaliy Kaurov
Thanks Vitaliy for suggesting Spline Sketchpad, it certainly does what I set out to do, and more. However, I tweek my original program to mke it work very nicely - here it is:
Module[{n, A, a, p}, n = 0; A = Array[a, 5000];
Manipulate[(n++; A[[n]] = p;
   ListLinePlot[A[[1 ;; n]],
    PlotRange -> {{-10, 10}, {-10, 10}}]), {{p, {0, 0}}, Locator},
  TrackedSymbols -> {p}]]
All it required was to plot n points of array A, rather than the whole array as I first had it, and also to add  "TrackedSymbols -> {p}" so that Manipulate updates only whan the locator p is moved. The resulting drawing exports normally to pdf. It is a much simpler program than Spline Sketchpad, and for me, does all that I want it to do.
I very much like your solution Boris, it is simple and clean. But there is one thing that can be avoided - preliminary fixed size array setting. Here is a version that starts from array of unit size and grows it as you draw. If you do not move the mouse array size stays fixed as can be seen from plot label.
Manipulate[
pts = If[Last[pts] == p, pts, pts~Join~{p}];
ListLinePlot[pts, PlotRange -> {{-10, 10}, {-10, 10}}, PlotLabel -> Framed@Length[pts]],
{{p, {0, 0}}, Locator},
{{pts, {{0, 0}}}, ControlType -> None}]
POSTED BY: Vitaliy Kaurov
A great improvement that I'd like to understand better! Normally, a statement like 
pts = If[Last[pts] == p, pts, pts~Join~{p}]
would lead to an infinite loop, yet here it doesn't. Why is that? The trick appears to be making the array pts a control with "no control"
{{pts, {{0, 0}}}, ControlType -> None}
Very confusing for a novice like me! I'd be grateful if you could explain why this works!
No ControlType -> None just localizes the variable pts inside Manipulate. Here is an example without ControlType -> None and it is still works:
pts = {{0, 0}};
Manipulate[
pts = If[Last[pts] == p, pts, pts~Join~{p}];
ListLinePlot[pts, PlotRange -> {{-10, 10}, {-10, 10}},
  PlotLabel -> Framed@Length[pts]],
{{p, {0, 0}}, Locator}]
The concept we see here is called "Automatic Reevaluation" or "Self-triggered Dynamic". You can read about it in the 1st paragraphs of this tutorial:

Advanced Manipulate Functionality
POSTED BY: Vitaliy Kaurov
Reply to this discussion
Community posts can be styled and formatted using the Markdown syntax.
Reply Preview
Attachments
Remove
or Discard

Group Abstract Group Abstract