1) Beautify and show also 3D images of fields. Combine various type of graphics using Show and Textures. If you can make them interactive and rotatable in 3D - it is much much better. This is why you need to use
CDF technology or upcoming
Wolfram CLoud technology. For beautification browse documentation pages on functions (especially the section called "Neat Examples")
- VectorPlot
- VectorDensityPlot
- StreamPlot
- StreamDensityPlot
- ContourPlot
- DensityPlot
- LineIntegralConvolutionPlot
Here are a few quick and dirty examples. Build texture based on the field gradient:
arrowss =
Rasterize[
StreamDensityPlot[
Evaluate[Grad[Sin[Cos[x] x - y], {x, y}]], {x, -3, 3}, {y, -3, 3},
VectorScale -> {Automatic, Automatic, Log[#5 + 1] &},
Frame -> False, ColorFunction -> "Rainbow", PlotRangePadding -> 0]]
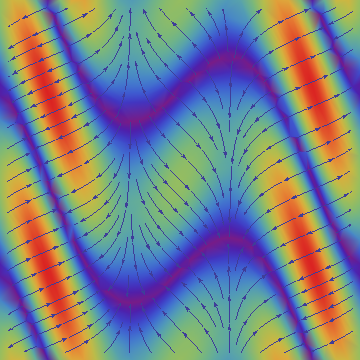
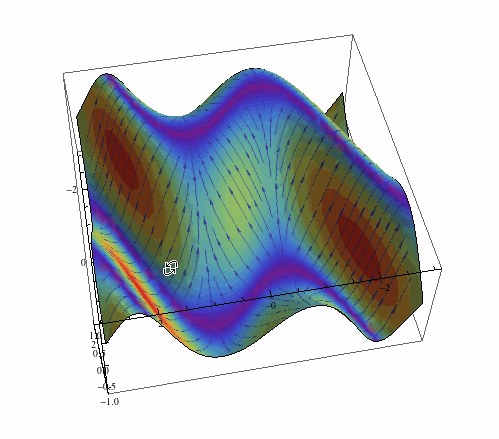
Now add it on the 3D plot of the field itself:
Plot3D[Sin[Cos[x] x - y], {x, -3, 3}, {y, -3, 3}, Mesh -> None,
PlotStyle -> Texture[arrowss], Lighting -> "Neutral",
SphericalRegion -> True]
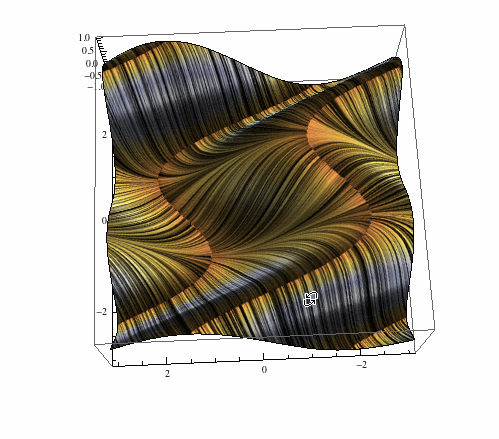
Something more fancy now:
arrows = Rasterize[
LineIntegralConvolutionPlot[{{-Cos[y - x Cos[x]] (-Cos[x] +
x Sin[x]), -Cos[y - x Cos[x]]}, {"noise", 500, 500}}, {x, -3,
3}, {y, -3, 3}, ColorFunction -> "BeachColors",
LightingAngle -> 0, LineIntegralConvolutionScale -> 3,
Frame -> False, PlotRange -> {{-3, 3}, {-3, 3}}]]
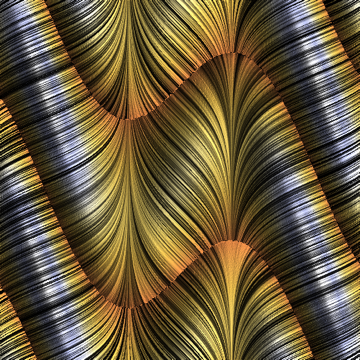
Plot3D[Sin[Cos[x] x - y], {x, -3, 3}, {y, -3, 3}, Mesh -> None,
PlotStyle -> Texture[arrows], Lighting -> "Neutral",
SphericalRegion -> True]
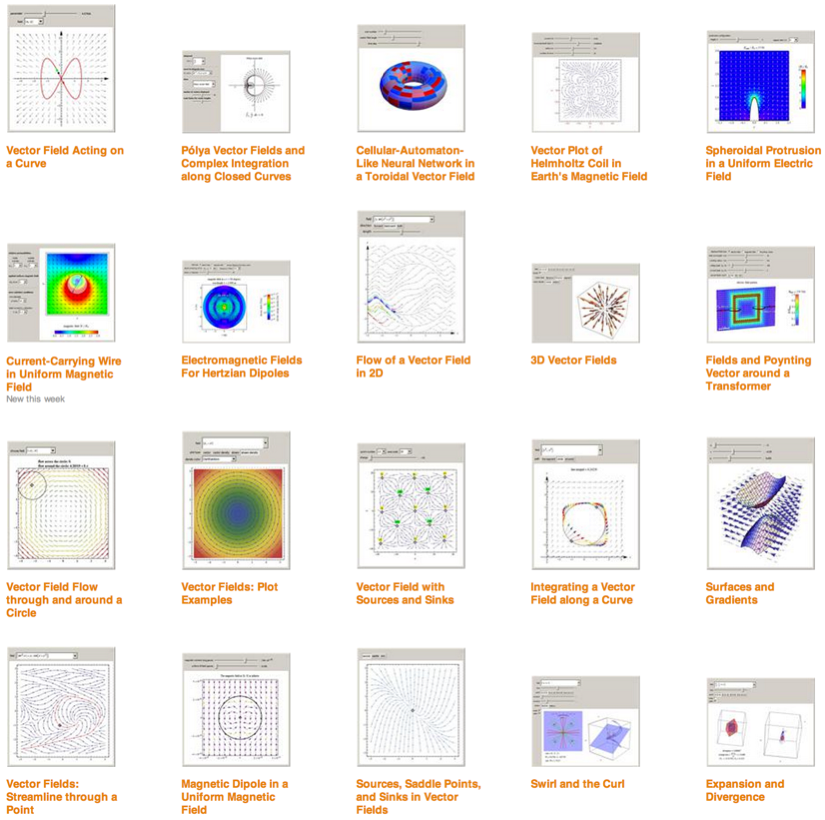
2) For inspiration browse The Wolfram Demonstration Project and search for typical keywords like
vector field for example. You can use those applications in your webpage by simple Java Script embedding. Or re-use there code for your purposes and inspiration. Among those you can find Demonstrations like
Vector Fields: Plot ExamplesVisualizing the Gradient VectorSwirl and the CurlDirectional DerivativesThere is much more there.