Message Boards Message Boards

3
|
15315 Views
|
2 Replies
|
7 Total Likes
View groups...
Share
Share this post:

Plotting of Grad-Div-Curl fields for educational purposes

The purpose of this post is to ask the Mathematica community to chime in on (i) how to best teach students concepts of Grad - Div - Curl using Mathematica, and (ii) how to optimally represent such fields for certain classes of functions using Mathematica's advanced graphical capabilities.


I co-authored an introductory textbook on electromagnetics that uses Java applets to illustrate many concepts; the applets are available on a publicly accessible website http://em.eecs.umich.edu/ulaby_modules.html. Several applets plot the Grad, Div, and Curl of a predefined set of functions, which the student can select from a table. After answering a few questions, the applet displays a Mathematica generated jpg -- Wolfram is acknowledged. The Grad, Div and Curl applets are available at

Grad: http://em.eecs.umich.edu/ch3/mod2/mod2.html
Div: http://em.eecs.umich.edu/ch3/mod3/mod3.html
Curl: http://em.eecs.umich.edu/ch3/mod4/mod4.html

For example, for the function f(x,y) = x^2 + y^2 the applet displays the following "2D field line plot". Additional display options are available. 


I encourage everyone to test-drive some of the applets.  My co-authors and I are not satisfied with the quality and educational value of these applets and would like to solicit input from this community for improving them (again, all applets are and will remain posted on a publically accessible website).

(i) On a fundamental level, how do we best augment classroom teaching of Grad-Div-Curl concepts using Mathematica?

(ii) On a more detailed level, how can we improve the various 2D and 3D Mathematica-generated plots that these applets display?  Admittedly, we used very primitive Mathematica commands to generate them.  Simply by leveraging more complex plotting functions and options we may be able to better illustrate these concepts.

All input would be greatly appreciated.

Thanks,
Eric Michielssen
POSTED BY: Eric Michielssen
2 Replies
1) Beautify and show also 3D images of fields. Combine various type of graphics using Show and Textures. If you can make them interactive and rotatable in 3D - it is much much better. This is why you need to use CDF technology or upcoming Wolfram CLoud technology. For beautification browse documentation pages on functions (especially the section called "Neat Examples")
  • VectorPlot
  • VectorDensityPlot
  • StreamPlot
  • StreamDensityPlot
  • ContourPlot
  • DensityPlot
  • LineIntegralConvolutionPlot
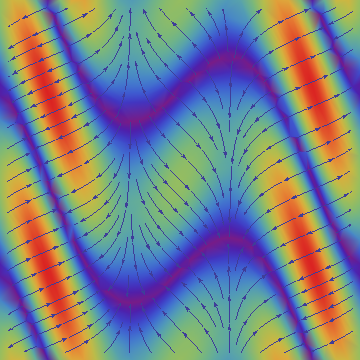
Here are a few quick and dirty examples. Build texture based on the field gradient:
arrowss =
Rasterize[
  StreamDensityPlot[
   Evaluate[Grad[Sin[Cos[x] x - y], {x, y}]], {x, -3, 3}, {y, -3, 3},
   VectorScale -> {Automatic, Automatic, Log[#5 + 1] &},
   Frame -> False, ColorFunction -> "Rainbow", PlotRangePadding -> 0]]


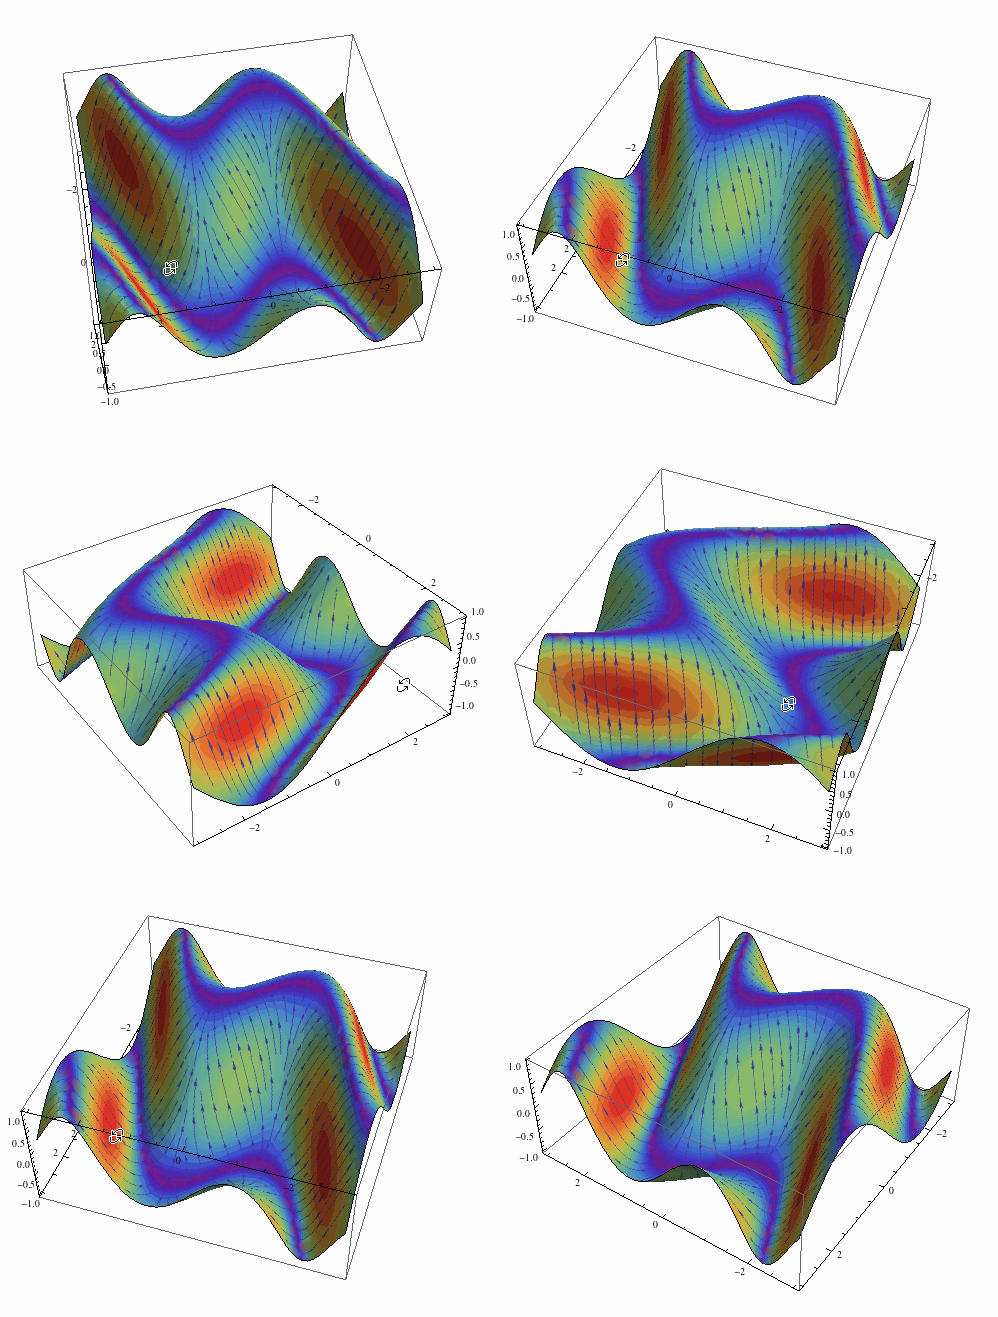
Now add it on the 3D plot of the field itself:
Plot3D[Sin[Cos[x] x - y], {x, -3, 3}, {y, -3, 3}, Mesh -> None,
PlotStyle -> Texture[arrowss], Lighting -> "Neutral",
SphericalRegion -> True]


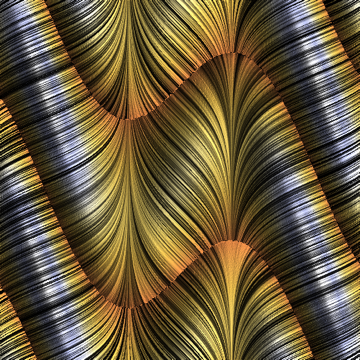
Something more fancy now:
arrows = Rasterize[
  LineIntegralConvolutionPlot[{{-Cos[y - x Cos[x]] (-Cos[x] +
        x Sin[x]), -Cos[y - x Cos[x]]}, {"noise", 500, 500}}, {x, -3,
    3}, {y, -3, 3}, ColorFunction -> "BeachColors",
   LightingAngle -> 0, LineIntegralConvolutionScale -> 3,
   Frame -> False, PlotRange -> {{-3, 3}, {-3, 3}}]]


Plot3D[Sin[Cos[x] x - y], {x, -3, 3}, {y, -3, 3}, Mesh -> None,
PlotStyle -> Texture[arrows], Lighting -> "Neutral",
SphericalRegion -> True]
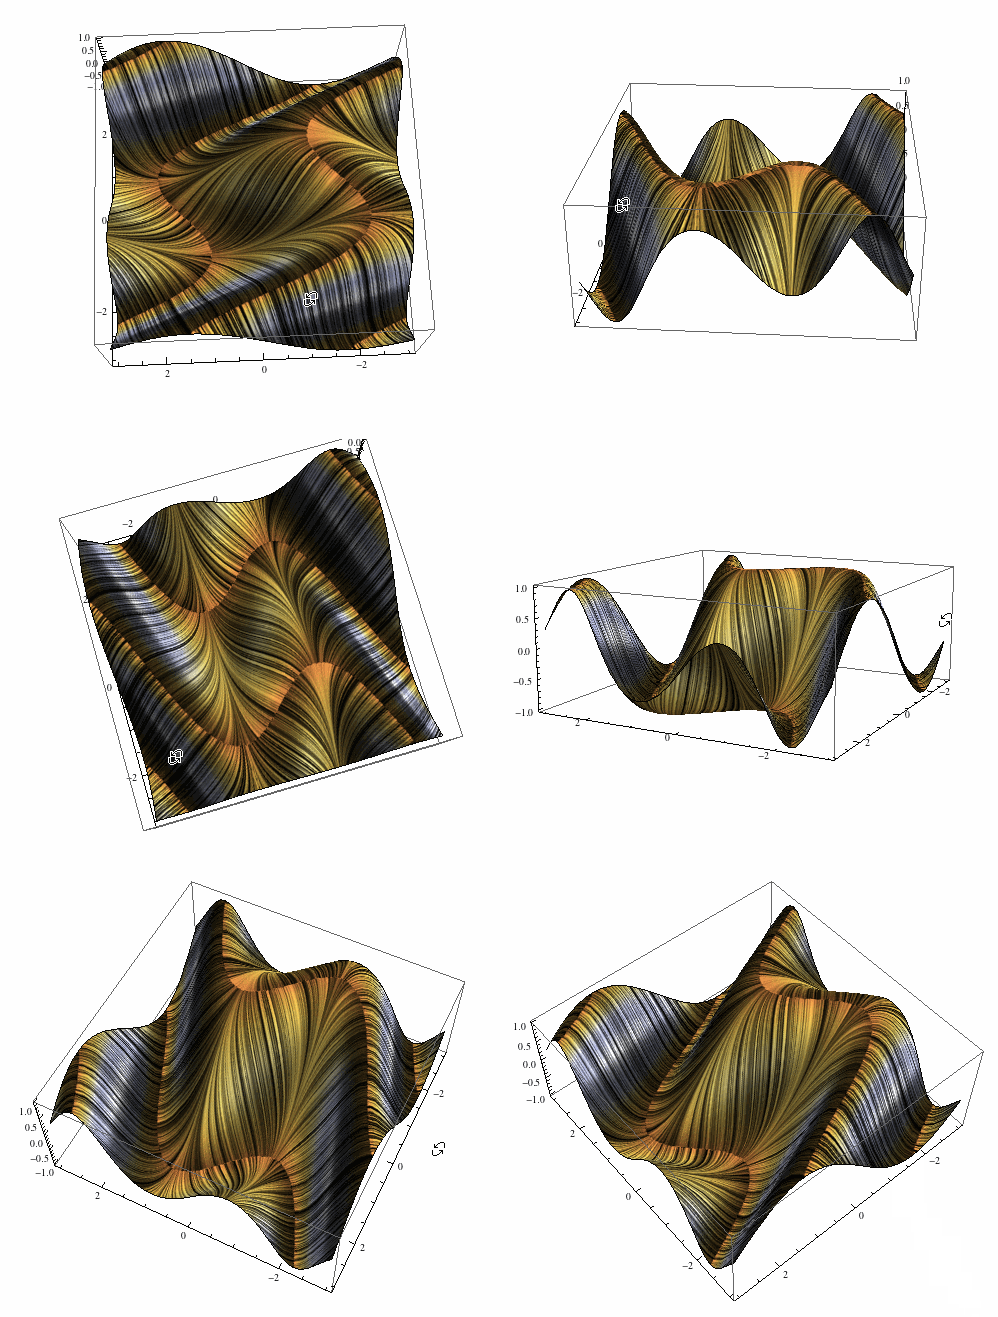


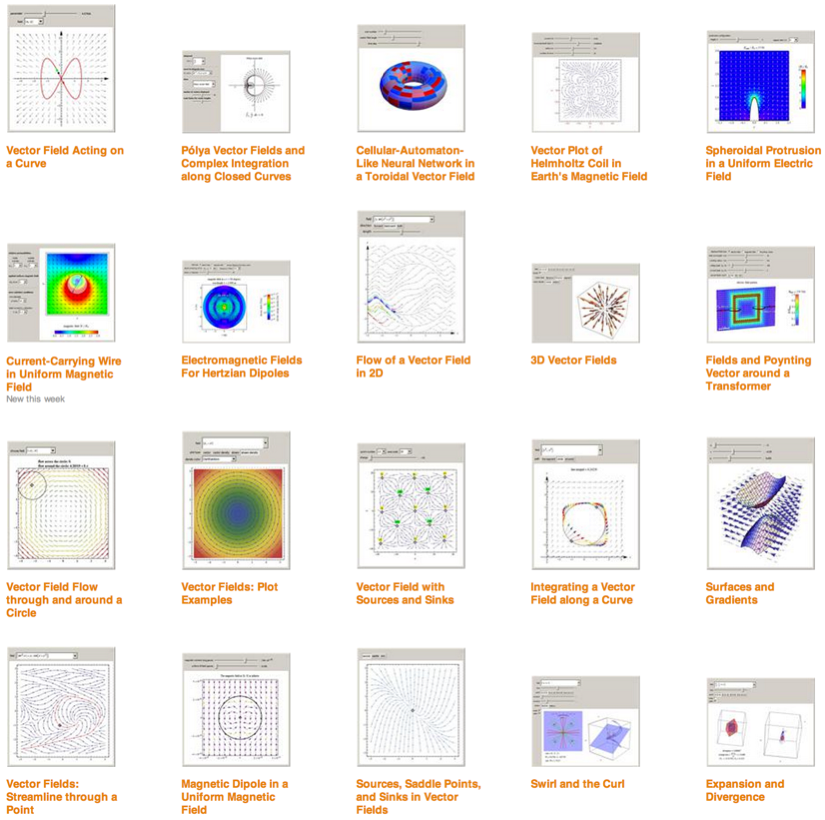
2) For inspiration browse The Wolfram Demonstration Project and search for typical keywords like vector field for example. You can use those applications in your webpage by simple Java Script embedding. Or re-use there code for your purposes and inspiration. Among those you can find Demonstrations like

Vector Fields: Plot Examples
Visualizing the Gradient Vector
Swirl and the Curl
Directional Derivatives

There is much more there.

POSTED BY: Vitaliy Kaurov
One idea is to have something like  a 1*1*1 or 3*3*3 size grid that you can drag around with a locator. At the corners of the grid might be field lines. Various derived quantities for the grid could be displayed e.g. div etc. The advantage is to allow a lot of parameters and computing to be displayed without over burdening the entire field. Also it is interactive which is fun. I tried out a similar idea to build intuition on complex analysis. It wasn't fantastic, but there was an additional problem there of branches etc.
POSTED BY: William Stewart
Reply to this discussion
Community posts can be styled and formatted using the Markdown syntax.
Reply Preview
Attachments
Remove
or Discard

Group Abstract Group Abstract