Group Abstract Group Abstract

Message Boards Message Boards

Any suggestions for displaying text Grid with Overlay plot?

Posted 7 years ago

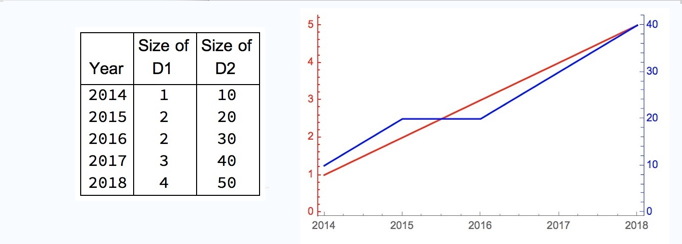
I want to present a text Grid and an Overlay Plot on the same line (Row) with useful scaling. I am stuck with an Overlay because I am displaying a 2-axes TimeSeries. The "My Goal" image was created by editing 2 JPEGs. How can I create the equivalent presentation directly in Mathematica? I am using Version 11.1, without the new presentation features of 11.3. My goal:

My Goal

The closest I have gotten with the following demo data:

(* as a test case, create 2 fake time series *)
d1 = {1, 2, 3, 4, 5};
d2 = {10, 20, 20, 30, 40};
dateList = Table[DateList[{2014 + x, 1}], {x, 0, 4}];
yearList = 
  MapThread[DateString, {dateList, Table["Year", Length[dateList]]}];
ts1 = TimeSeries[d1, {dateList}];
ts2 = TimeSeries[d2, {dateList}];

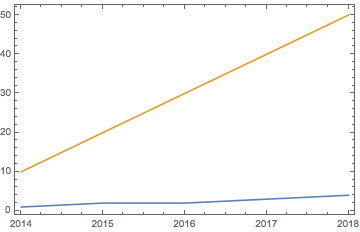
was initially presentable table (show above) and a NON-useful plot using:

(* on my first try at a presentation,  I did the following: *)
   labeledTable = 
     Grid[{Text@Style[#, "TableHeader"] & /@ {"\nYear", "Size of\n   D1", 
         "Size of\n   D2"}, {Column[yearList], Column[d1], Column[d2]}}, 
      Alignment -> {Center}, Frame -> All]
    DateListPlot[{ts1, ts2}]

HiddenDetails

The plot needed 2 axes. I believe the TimeSeries forced use of an Overlay:

    (* to make a 2 axes DateListPlot, it seems one must use an Overlay... *)
plot1 = 
      DateListPlot[ts1, PlotStyle -> Red, 
       Frame -> {True, True, False, False},
       ImagePadding -> 25, FrameTicks -> {None, All, None, None}, 
       FrameStyle -> {{Directive[Red], None}, {None}}];
    plot2 = DateListPlot[ts2, PlotStyle -> Blue, 
       Frame -> {False, False, False, True}, ImagePadding -> 25, 
       FrameTicks -> {{None, All}, {None, None}}, 
       FrameStyle -> {{None, Directive[Blue]}, {None}}];
    overPlot = Overlay[{plot1, plot2}]

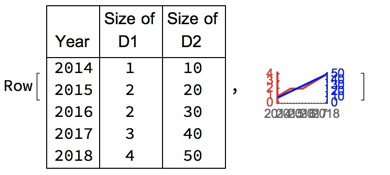
This was nice, but I can't get the desired presentation format, combining the plot with the table. The problem seems to be that an Overlay is not a scalable Graphic, and neither Row[labeledTable,overPlot] nor Grid[labeledTable,overPlot] is very pretty.

YUK!!

I would appreciate any suggestions, even if you only have a better way to generate or display the test data grid (like how to center a 2-line column header over decimal data).

POSTED BY: diller ryan
6 Replies

Gustavo,

I agree it is not easy to find. I often use a search engine (duckduckgo) to search the mathematica documentation if I can't find it quickly using the built-in documentation search. In this case I remembered it existed so I did a web search and not a documentation search. However, I also found it relatively quickly by opening up the documentation for "Plot" and followed the links at the bottom for "Basic Plotting" tutorial and then following a link to "How To: Create Plots". This index had many useful pages including plotting with two axes. I find the documentation works well if you find a command that is close and follow the links.

I suggest reporting this issue to support and maybe they will make the searching more affective in the future.

Regards,

Neil

POSTED BY: Neil Singer

guide/HowToTopics >> howto/CreatePlots >> howto/GeneratePlotsWithTwoVerticalScales

yee not so easy to find this in the Search hit list.

maybe sometimes Browse is the way to go

POSTED BY: Raspi Rascal
POSTED BY: Gustavo Delfino
POSTED BY: Jos Klaps

I like Neil's method with ImageSize->Large . Nice!

POSTED BY: Raspi Rascal

diller,

First, there is a good reference for plotting with two Y axes on the Wolfram site. The function can be easily modified to do DateListPlots by changing "Plot" and removing the range list and adjusting a few parameters. Then your plot will not be an overlay and will be a bit more general. See How to | Generate Plots with Two Vertical Scales. This will not fix your second problem but it may be useful.

To fix the second problem, you need to specify the ImageSize for the plots (which will carryover to the overlay). If you do this I think you get what you want.

plot1 = DateListPlot[ts1, PlotStyle -> Red, 
   Frame -> {True, True, False, False}, ImagePadding -> 25, 
   FrameTicks -> {None, All, None, None}, 
   FrameStyle -> {{Directive[Red], None}, {None}}, ImageSize -> Large];
plot2 = DateListPlot[ts2, PlotStyle -> Blue, 
   Frame -> {False, False, False, True}, ImagePadding -> 25, 
   FrameTicks -> {{None, All}, {None, None}}, 
   FrameStyle -> {{None, Directive[Blue]}, {None}}, 
   ImageSize -> Large];
overPlot = Overlay[{plot1, plot2}]

Now you can use Row or Grid:

Row[{labeledTable, overPlot}]

To get:

enter image description here

Of course the Plot is a bit too big so you can adjust the sizes accordingly. ImageSize can also take numerical sizes. You can also specify the size of your grid. I hope this helps.

Regards,

Neil

POSTED BY: Neil Singer
Reply to this discussion
Community posts can be styled and formatted using the Markdown syntax.
Reply Preview
Attachments
Remove
or Discard