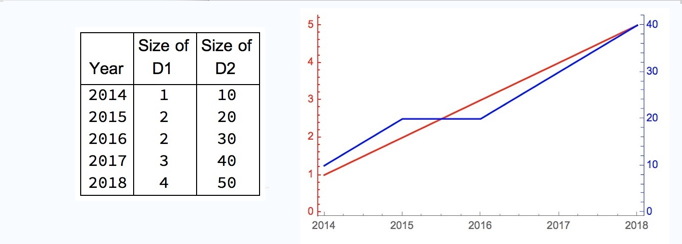
I want to present a text Grid and an Overlay Plot on the same line (Row) with useful scaling. I am stuck with an Overlay because I am displaying a 2-axes TimeSeries. The "My Goal" image was created by editing 2 JPEGs. How can I create the equivalent presentation directly in Mathematica? I am using Version 11.1, without the new presentation features of 11.3. My goal:

The closest I have gotten with the following demo data:
(* as a test case, create 2 fake time series *)
d1 = {1, 2, 3, 4, 5};
d2 = {10, 20, 20, 30, 40};
dateList = Table[DateList[{2014 + x, 1}], {x, 0, 4}];
yearList =
  MapThread[DateString, {dateList, Table["Year", Length[dateList]]}];
ts1 = TimeSeries[d1, {dateList}];
ts2 = TimeSeries[d2, {dateList}];
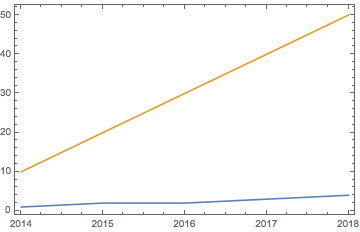
was initially presentable table (show above) and a NON-useful plot using:
(* on my first try at a presentation,  I did the following: *)
   labeledTable =
     Grid[{Text@Style[#, "TableHeader"] & /@ {"\nYear", "Size of\n   D1",
         "Size of\n   D2"}, {Column[yearList], Column[d1], Column[d2]}},
      Alignment -> {Center}, Frame -> All]
    DateListPlot[{ts1, ts2}]

The plot needed 2 axes. I believe the TimeSeries forced use of an Overlay:
    (* to make a 2 axes DateListPlot, it seems one must use an Overlay... *)
plot1 =
      DateListPlot[ts1, PlotStyle -> Red,
       Frame -> {True, True, False, False},
       ImagePadding -> 25, FrameTicks -> {None, All, None, None},
       FrameStyle -> {{Directive[Red], None}, {None}}];
    plot2 = DateListPlot[ts2, PlotStyle -> Blue,
       Frame -> {False, False, False, True}, ImagePadding -> 25,
       FrameTicks -> {{None, All}, {None, None}},
       FrameStyle -> {{None, Directive[Blue]}, {None}}];
    overPlot = Overlay[{plot1, plot2}]
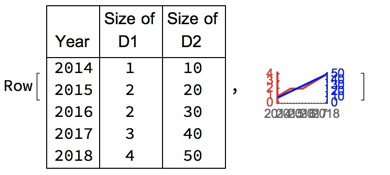
This was nice, but I can't get the desired presentation format, combining the plot with the table. The problem seems to be that an Overlay is not a scalable Graphic, and neither Row[labeledTable,overPlot] nor Grid[labeledTable,overPlot] is very pretty.

I would appreciate any suggestions, even if you only have a better way to generate or display the test data grid (like how to center a 2-line column header over decimal data).