You could discretize beforehand and then refer to the cells explicitly.
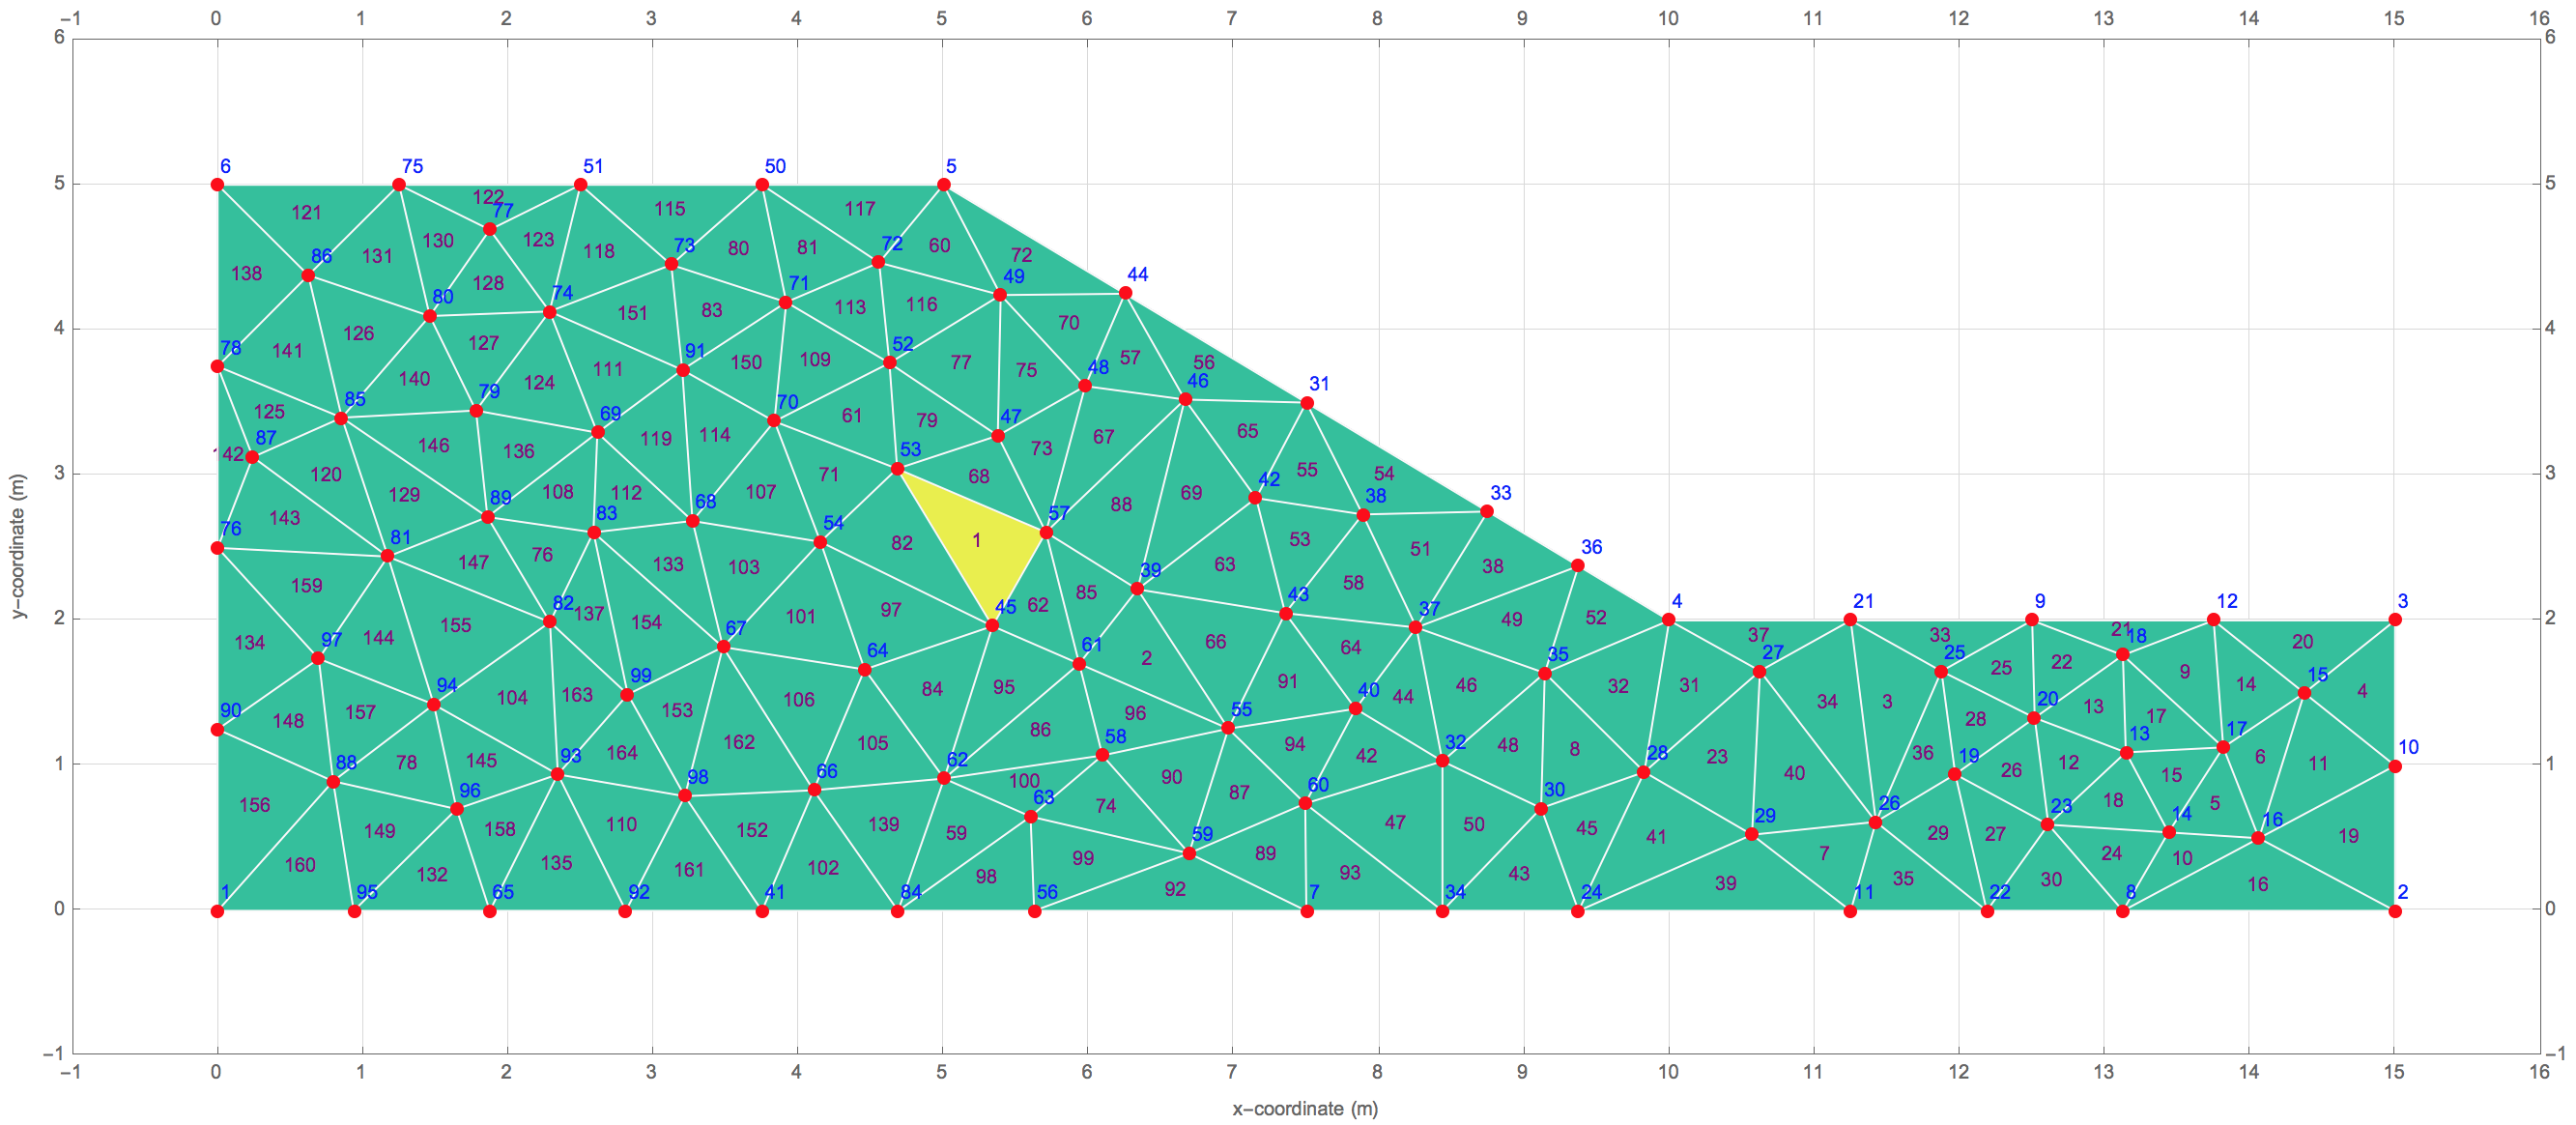
mr = DiscretizeRegion[Polygon[{{0, 0}, {15, 0}, {15, 2}, {10, 2}, {5, 5}, {0, 5}}], MaxCellMeasure -> 0.5];

MeshRegion[mr
    , Frame -> True
    , FrameTicks -> {x, x} /. x -> Range[-20, 20, 1]
    , FrameLabel -> {"x-coordinate (m)", "y-coordinate (m)"}
    , GridLines -> {x, x} /. x -> Range[-20, 20]
    , GridLinesStyle -> Directive[LightGray, Thin]
    , ImageSize -> Full
    , MeshCellLabel -> Join[(# -> Style[Last[#], Blue]& /@ MeshCellIndex[mr,0]), (# -> Style[Last[#], Purple]& /@ MeshCellIndex[mr,2])]
    , MeshCellStyle -> {{2, All} ->
       Directive[RGBColor[0, 0.75, 0.5, 0.75]], {2, 1} -> {Yellow,
        Opacity[0.75]}, {1, All} ->
       Directive[GrayLevel[0.975], Thickness[Medium]], {0, All} ->
       Directive[Red, PointSize[Large]]}
    (*,Method\[Rule]{"AxesInFront"\[Rule]True,
    "GridLinesInFront"\[Rule]True}*)
    , PlotRangePadding -> 1
    ]
As for your other question, the only work around I can find is to add the option BaseStyle -> {FaceForm[]}. Then any face you want colored, you'll need to specify a FaceForm, e.g.
MeshCellStyle -> {..., {2, 1} -> {FaceForm[Yellow], Opacity[0.75]}, ...}
I'm not really sure why this is needed.


