The code in the notebook attached to this post sets forth my efforts to develop custom neural network architectures to work on datasets found in social sciences (or other fields). It is the result of a lot of trial and even more error. It shows how to do the following things. Some of this is covered in the Wolfram Language documentation, but not as an extensive worked example.
- Create numerical vectors out of nominal data
- Develop a loss function when the target consists of nominal data
- Use ClassifierMeasurements when the classifier is the output of a trained neural network
- Specify what form the neural network must be in for ClassifierMeasurements to work and how to modify a non-conforming trained network to be in the appropriate form.
- Show equivalent NetChains and NetGraphs
- Show how the neural network can itself encode nominal data contains as values to Associations, catenate that data and then pipe it through the rest of a NetGraph.
- Show how to hook up a loss function to the output of a neural network
- How to see the innards of a neural network more clearly, as well as the plan to convert it to something useable by MXNet.
- How to work with Datasets and Query.
I strongly suspect that this is not the most efficient way create a neural network to analyze data contained in a Dataset with named columns and lots of nominal variable variables. However, it's the best I can do for now. I hope it is instructive to others. More importantly perhaps, I hope that these efforts will inspire others more knowledgeable in the field to show (1) how this can all be done in a more efficient manner and (2) how other bells and whistles can be added, such as a custom loss function, weighted inputs, desired distribution of predictions, etc.. While the Wolfram documentation on neural networks is extensive, as of version 11.3, in which the functionality is still deemed "Experimental," it lacks, in my view, the conceptual perspective and range of worked examples from diverse fields that I think would lower the desired barriers to entry for non-expert users of machine learning.
Note:
I did receive some excellent assistance in this effort from Wolfram Technical Support, but there comes a point when you kind of want to do it on your own. My efforts in asking the community.wolfram.com website for assistance didn't receive any immediate response and so, being the persistent sort, I decided just to try and do it on my own.
Do the Encoding Before We Get to NetTrain
Download the Titanic and convert it from a Dataset to a list of associations.
Short[titanic = Normal@ExampleData[{"Dataset", "Titanic"}]]
Scramble the data, delete the missing values to keep things simple, and encode survival in a way I prefer.
titanic2 =
  Query[RandomSample /* (DeleteMissing[#, 1,
        2] &), {"survived" -> (If[#, "survived", "died"] &)}][titanic];
Encode the nominal data as unit vectors.
titanic3 =
 Query[All,
   List["class" -> NetEncoder[{"Class", {"1st", "2nd", "3rd"}, "UnitVector"}],
     "sex" -> NetEncoder[{"Class", {"male", "female"}, "UnitVector"}]]][
  titanic2]
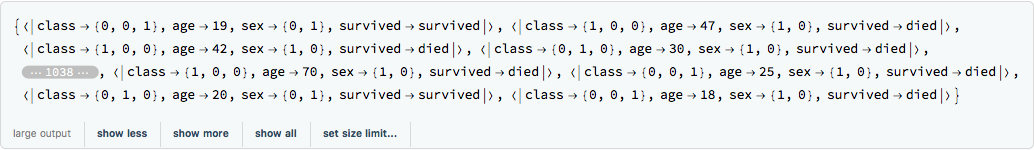
Get the data as a list of six values ruled onto a single value.
Short[titanic4 = Query[All, Values /* (Flatten[Most[#]] -> Last[#] &)][titanic3]]

Form training and testing data sets.
Short[{trainingData, testData} = TakeDrop[titanic4, Round[0.7*Length[titanic4]]]]

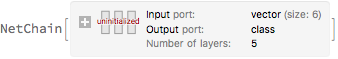
Create a pretty basic net chain ending with a SoftmaxLayer[] that turns the output into probabilities.
chainlinks = {LinearLayer[12], ElementwiseLayer[LogisticSigmoid],  LinearLayer[4], LinearLayer[2], SoftmaxLayer[]};

nc = NetChain[chainlinks, "Input" -> 6,  "Output" -> NetDecoder[{"Class", {"died", "survived"}}]]
Just test the NetChain to see if it works.
NetInitialize[nc][{0, 0, 1, 18, 1, 0}]
"died"
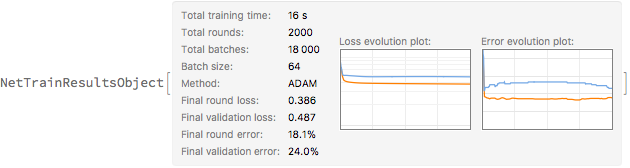
Train the neural net. Use the CrossEntropy loss as the function to minimize. Remember that the target data needs to be encoded from died and survived to 1 and 2. Otherwise the CrossEntropyLossLayer gets unhappy. After 2000 rounds I find it's all overfitting anyway. So I limit the training rounds.
chainTrained = NetTrain[nc, trainingData, All, ValidationSet -> Scaled[0.2],  LossFunction ->  CrossEntropyLossLayer["Index",
        "Target" -> NetEncoder[{"Class", {"died", "survived"}}]],  MaxTrainingRounds -> 2000]
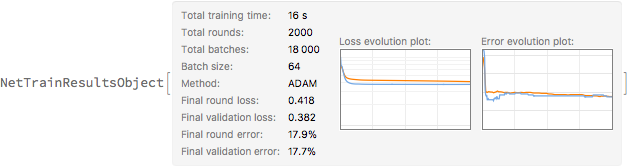
Get the TrainedNet out of the NetTrainResultsObject and see how our classifier performed.
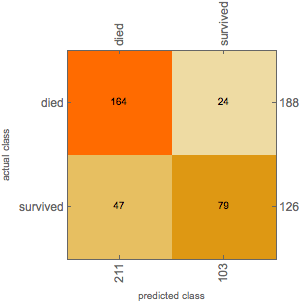
cmo = ClassifierMeasurements[chainTrained["TrainedNet"], testData]

cmo["ConfusionMatrixPlot"]

Not bad. (But not great. The question is whether that's the fault of the classifier or just irreducible noise in the data).
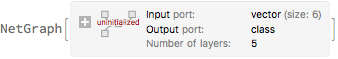
Now do it with NetGraph
Same data, but do it with a NetGraph.
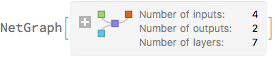
ngt = NetGraph[chainlinks, {1 -> 2 -> 3 -> 4 -> 5}, "Input" -> 6,
  "Output" -> NetDecoder[{"Class", {"died", "survived"}}]]
From here on in, it' s all exactly the same.
graphTrained =
 NetTrain[ngt, trainingData, All, ValidationSet -> Scaled[0.2],
  LossFunction ->
   CrossEntropyLossLayer["Index",
    "Target" -> NetEncoder[{"Class", {"died", "survived"}}]],
  MaxTrainingRounds -> 2000]
graphCmo = ClassifierMeasurements[graphTrained["TrainedNet"], testData]

graphCmo["ConfusionMatrixPlot"]
Not surprisingly, the results are very similar.
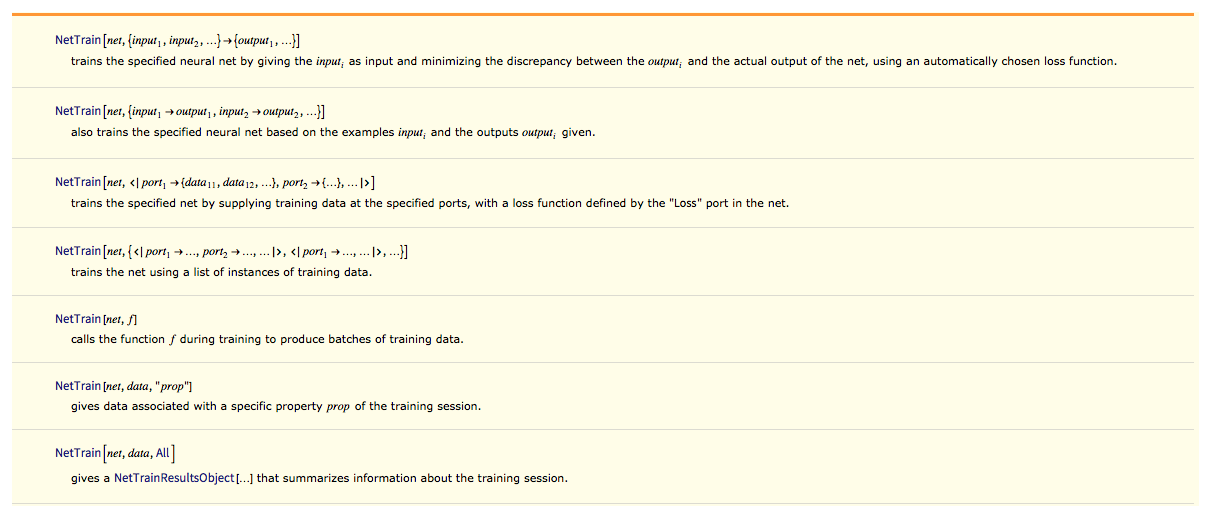
Now Do the Encoding Within NetTrain
Now, I want to do it with the data in a different form. I want the neural network to do the encoding. And I want to at least think about having a custom loss function. Convert the form of the data so that it is "column oriented." Basically we are going to use the third variant in the function specification set forth below.
{trainingData2, testData2} = Map[Normal[Transpose[Dataset[#]]] &, TakeDrop[titanic2, Round[0.7*Length[titanic2]]]];
Here' s what the training Data looks like.
Keys[trainingData2]
{"class", "age", "sex", "survived"}
Map[Short, Values[trainingData2]]

Now form a NetGraph that Catenates some of the values from the data together and then goes through the same process as our NetChain (and NetGraph) above. Add a loss function at the end. Note that the data coming in from the Target port into the "myloss" layer is encoded from nominal values died and survived into integers 1 and 2.
nodes = Association["catenate" -> CatenateLayer[], "l15" -> LinearLayer[15],
   "ls1" -> ElementwiseLayer[LogisticSigmoid], "l5" -> LinearLayer[5],
   "l2" -> LinearLayer[2], "sm" -> SoftmaxLayer[],
   "myloss" ->
    CrossEntropyLossLayer["Index",
     "Target" -> NetEncoder[{"Class", {"died", "survived"}}]]];
Create the connectivity structure between the nodes. Note that I am careful to specify which connectors of various NetPorts connect with other NetPort connectors. Certain Layers, like CrossEntropyLossLayer have connector names that the user can't alter so far as I can figure out. The connector name "Target" for example, needs to stay "Target." Also notice that I believe I have to generate a NetPort["Loss"] for the network to be trained.
connectivity = {{NetPort["class"], NetPort["age"], NetPort["sex"]} ->
"catenate", "catenate" -> "l15" -> "ls1" -> "l5" -> "l2" -> "sm",
"sm" -> NetPort["myloss", "Input"],
NetPort["survived"] -> NetPort["myloss", "Target"],
"myloss" -> NetPort["Loss"], "sm" -> NetPort["Output"]}
  {{NetPort["class"], NetPort["age"], NetPort["sex"]} -> "catenate",
  "catenate" -> "l15" -> "ls1" -> "l5" -> "l2" -> "sm",   "sm" ->
  NetPort["myloss", "Input"],   NetPort["survived"] -> NetPort["myloss",
  "Target"],   "myloss" -> NetPort["Loss"], "sm" -> NetPort["Output"]}
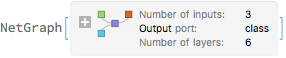
Now let' s put our NetGraph together. Here I have to tell it how various inputs and outputs will be encoded and decoded. You will notice I do NOT tell it how to encode the "survived" values because our CrossEntropyLossLayer handles that part of the work.
ngt2 = NetGraph[nodes, connectivity,
"class" -> NetEncoder[{"Class", {"1st", "2nd", "3rd"}, "UnitVector"}],
"age" -> "Scalar",
"sex" -> NetEncoder[{"Class", {"male", "female"}, "UnitVector"}],
"Output" -> NetDecoder[{"Class", {"died", "survived"}}]]
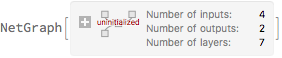
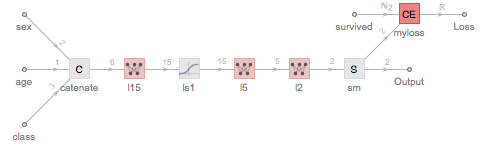
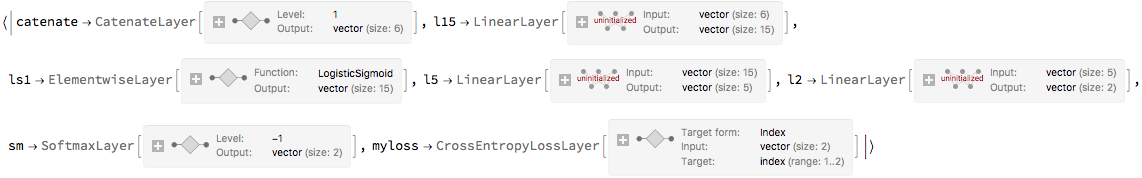
Here' s a picture of our net.
NetInformation[ngt2, "FullSummaryGraphic"]
We can get the structure information back out of the NetGraph using some "secret" functions. I found these useful when working on this project to help me understand what was going on.
NeuralNetworks`GetNodes[ngt2]
NeuralNetworks`NetGraphEdges[ngt2] (* shouldn't this be called GetEdges for consistency??*; or maybe GetNodes should be NetGraphNodes??*)
{NetPort["class"] -> NetPort[{"catenate", 1}],
NetPort["age"] -> NetPort[{"catenate", 2}],
NetPort["sex"] -> NetPort[{"catenate", 3}],
NetPort["survived"] -> NetPort[{"myloss", "Target"}],
NetPort[{"catenate", "Output"}] -> "l15", "l15" -> "ls1", "ls1" -> "l5",
"l5" -> "l2", "l2" -> "sm", "sm" -> NetPort[{"myloss", "Input"}],
"sm" -> NetPort["Output"], NetPort[{"myloss", "Loss"}] -> NetPort["Loss"]}
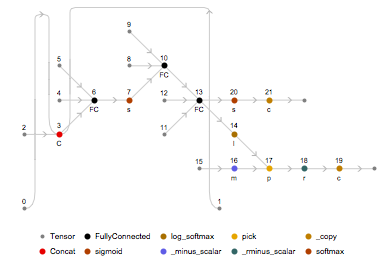
We can also get a closer look at what the neural net is going to do, athough, frankly, I don' t understand the diagram fully. It does look cool, though. (I believe the diagram essentially shows how the Wolfram Language framework will be translated to MXNet).
NeuralNetworksNetPlanPlot[NeuralNetworksToNetPlan[ngt2]]
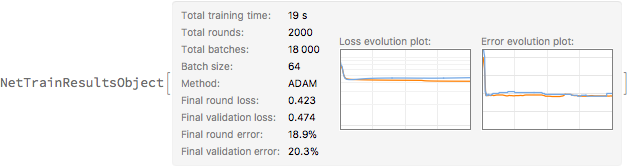
Anyway, let' s train the network. Notice how I designate the loss function with a string that refers to a node (NetPort) in the network. I'm not quite sure why, but you can't designate the loss function as "myloss"; again, I wish the documentation were clearer on this issue. Again, I'll stop after 2000 rounds.
titanicNet2 =
NetTrain[ngt2, trainingData2, All, LossFunction -> "Loss",
ValidationSet -> Scaled[0.2], MaxTrainingRounds -> 2000]
We can extract the trained network from the NetTrainResultsObject.
titanicNet2["TrainedNet"]
Let' s run it on the test data.
Short[titanicNet2["TrainedNet"][testData2]]

![enter image description here][20]
If I try to use ClassifierMeasurements on it, though, it fails.
ClassifierMeasurements[titanicNet2["TrainedNet"], testData2];

The error message is unhelpful. And nothing I could find in the documentation spells out the circumstances under which the results of a neural network can be used in ClassifierMeasurements. Maybe, however, it's because our NetGraph is producing two outputs: a Loss value and an Output value. When we make Classifiers, to be the best of my knowledge, we only get an Output value. Let's trim the network.
titanicNet2Trimmed = NetDelete[titanicNet2["TrainedNet"], "myloss"]
Now, when we run our trimmed network on the test data (stripped of the survived column), we just get output values as a List and not as part of a multi-key Association.
titanicNet2Trimmed[Query[KeyDrop["survived"]][testData2]]

And now ClassifierMeasurements works!!
cmo2 = ClassifierMeasurements[titanicNet2Trimmed, testData2 -> "survived"]
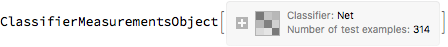
cmo2["ConfusionMatrixPlot"]

Conclusion
I hope the code above helps others in appreciating the incredible neural network functionality built into the Wolfram language and inspires further posts on how it can be used in creative and flexible ways.
 Attachments:


