@Anna,
You can also use customized bubble chart to visualize a 5-dimensional data. Example: The following function works for data points like
point = {0.86882, 1.9605, 1.82299, 0.222908, 1.09061}
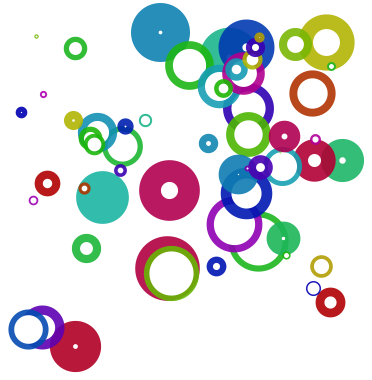
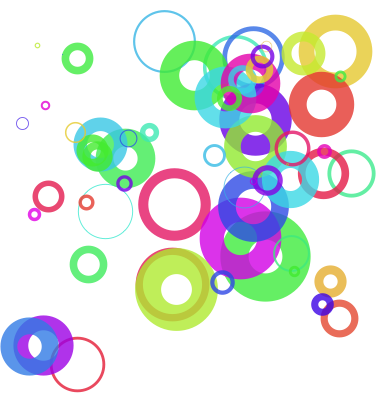
The first two elements are the x-y coordinates; the third element is the radius of a bubble; the fourth element is the hollowness of a bubble; the last element determines the color scale. CustomizedBubble is a sample implementation. Note that the last three values are nomalized in visualization. An option is added so I can toggle between two bubble styles: disk and ring
CustomizedBubble::optf = "the option value is not defined";
Options[CustomizedBubble]={"BubbleStyle"-> "Disk"};
CustomizedBubble[ls_,opts:ptionsPattern[]]:=Module[
{minVal3,maxVal3,minVal4,maxVal4,minVal5,maxVal5,r3,r4,hue5,res,p,bstyle},
(*Normalize the 3rd, 4th and 5th element in a list*)
{minVal3,maxVal3}=Through[{Min,Max}[data[[All,3]]]];
{minVal4,maxVal4}=Through[{Min,Max}[data[[All,4]]]];
{minVal5,maxVal5}=Through[{Min,Max}[data[[All,5]]]];
r3=(ls[[3]]-minVal3)/(maxVal3-minVal3)*0.2;
r4=(ls[[4]]-minVal4)/(maxVal4-minVal4)*r3;
hue5=(ls[[5]]-minVal5)/(maxVal5-minVal5);
(*check the style*)
bstyle=OptionValue["BubbleStyle"];
Which[
bstyle==="Disk",
r4=r4*0.8;
{
{Hue[hue5,1,.7,.9],Disk[{ls[[1]],ls[[2]]},r3]},{White,Disk[{ls[[1]],ls[[2]]},r4]}
},
bstyle==="Ring",
r4=r4*0.4;
{Hue[hue5,0.8,.9,0.8],Thickness[r4],Circle[{ls[[1]],ls[[2]]},r3]},
True, Message[CustomizedBubble::optf];{}
]
];
I generate some random data (for instance, a set of 60 "5-d" points) and apply the above function onto the points:
data = RandomReal[{0, 2}, {60, 5}];
I put a Sort function here to make sure that smaller circles are always atop the larger ones. Otherwise I can not see the circles with small radii
CustomizedBubble /@ Sort[data, (#1[[3]] > #2[[3]]) &];
Graphics[%]
The result is quite charming:

I can draw a similar graph with rings (the center is transparent) with "BubbleStyle" -> "Rings" option. This time the fourth element determines the thickness of a ring.
CustomizedBubble[#, "BubbleStyle" -> "Ring"] & /@ Sort[data, (#1[[3]] > #2[[3]]) &];
Graphics[%]
