Message Boards Message Boards

1
|
8208 Views
|
3 Replies
|
9 Total Likes
View groups...
Share
Share this post:

Finding distribution of time values from data

Posted 12 years ago
 Hi!
I have a dataset with time values from a simulation, 10.000+ values. It's a set of REAL values written to a datafile (txt or dat), in the following format, line by line:
6.38377
8.87789
7.30095
38.94862
48500.52913
3193.85159
[….]

What I would like to do is the following:
- Find the time distribution
- Present it as a smoothed graph representing the probability density distribution.

I have tried to Google it, read Mathematica references and otherwise try to solve this but couldn't find the solution. I hope someone here can help me. I'm new to Mathematica, as this primarily is a tool my professor makes us use (ever heard that one before? ;-)). Even a nudge in the right direction is appreciated!

Best regards,
Erik
POSTED BY: Erik Sorensen
3 Replies
Lets simulate some data distributed for example normally:
data = RandomVariate[NormalDistribution[3, 2.5], 10^4];

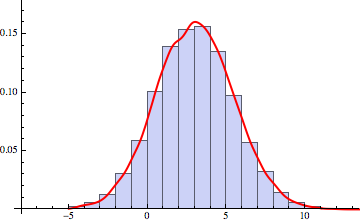
We can use so called SmoothKernelDistribution to build a general smooth distribution curve
SKD = SmoothKernelDistribution[data];

To show visually correspondence with data:
Show[Histogram[data, 20, "PDF"], Plot[PDF[SKD, x], {x, -5, 15}, PlotStyle -> Directive[Red, Thick]]]


But on other hand, if you would have a guess, what kind of known analytic distribution fits your case, you could try to find distribution parameters that fit your data best - and of course they are very close to the parameters we have chosen for original Gaussian to simulate your data:
params = FindDistributionParameters[data, NormalDistribution[a, b]]
Out[] = {a -> 3.00242, b -> 2.45767}

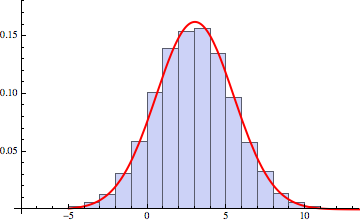
And you could check whether it is a good choice of distribution - in this case of course it is:
ND = NormalDistribution[a, b] /. params;
tstData = DistributionFitTest[data, ND, "HypothesisTestData"];
{tstData["AutomaticTest"], tstData["TestConclusion"]}


Plot:
Show[Histogram[data, 20, "PDF"], Plot[PDF[ND, x], {x, -5, 15}, PlotStyle -> Directive[Red, Thick]]]


Now you can easily find various probabilistic and statistical characteristics of this distributions:
Probability[5 < x < 10, x \[Distributed] SKD]
Out[] = 0.207631

Probability[5 < x < 10, x \[Distributed] ND]
Out[] = 0.205963

If you need a practical demonstration of this with real world data take a look at Vitaliy’s answer here: Finding the actual wind power at a location for a given period?
POSTED BY: Darya Aleinikava
use something like:
data= Select[data,#>0.5&]
data= Select[data,0.3<#<2&]
POSTED BY: Sander Huisman
Posted 12 years ago
Thank you very much Darya, your answer is highly appreciated. Much obliged.

But, with this newfound knowledge, a new question showed itself:

How do i remove values from a list that are GreaterEqual than some value? Or LessEqual for that matter.
POSTED BY: Erik Sorensen
Reply to this discussion
Community posts can be styled and formatted using the Markdown syntax.
Reply Preview
Attachments
Remove
or Discard

Group Abstract Group Abstract