Message Boards Message Boards

0
|
6721 Views
|
1 Reply
|
2 Total Likes
View groups...
Share
Share this post:

PlotLegends and only one column. How?

Posted 11 years ago
I would like to use PlotLegends with one column.  For example, I have 11 lines to plot.  The PlotLegends makes two columns: One with 8 rows and other with 3 rows.
I want one column with 11 rows.

Thanks
Ronai

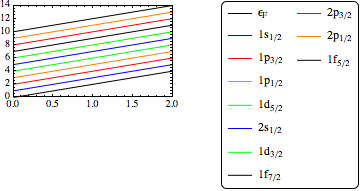
f[x_,b_]:=2x+b;Plot[{f[x,0],f[x,1],f[x,2],f[x,3],f[x,4],f[x,5],f[x,6],f[x,7],f[x,8],f[x,9],f[x,10]},{x,0,2},PlotStyle->{Black,Blue,Red,Orange,Green,Blue,Green,Black,Red,Orange,Black},PlotLegends->Placed[LineLegend[{"0", "1","2","3","4","5","6","7","8","9","10"},Joined->Automatic,LegendFunction->Frame,LegendMarkerSize -> {{25, 5}}], {{2, 1}, {1, 1}}]]


POSTED BY: Ronai Lisboa
@Ronai, 

You can just modify the LineLegend option a little bit to have the legend markers in one column: 
 colorList = {Black, Blue, Red, Orange, Green, Blue, Green, Black, Red,
  Orange, Black};
 f[x_, b_] := 2 x + b;
 Plot[{f[x, 0], f[x, 1], f[x, 2], f[x, 3], f[x, 4], f[x, 5], f[x, 6],
   f[x, 7], f[x, 8], f[x, 9], f[x, 10]}, {x, 0, 2},
  PlotStyle -> colorList, AspectRatio -> 0.95,
  PlotLegends ->
   Placed[LineLegend[colorList, ToString /@ Range[10],
     LegendMarkerSize -> {19, 8},
    LegendFunction -> "Frame"], {{1.3, 1}, {0.9, 1}}]]

POSTED BY: Shenghui Yang
Reply to this discussion
Community posts can be styled and formatted using the Markdown syntax.
Reply Preview
Attachments
Remove
or Discard

Group Abstract Group Abstract