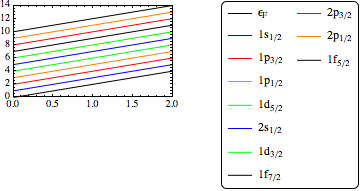
I would like to use PlotLegends with one column. For example, I have 11 lines to plot. The PlotLegends makes two columns: One with 8 rows and other with 3 rows.
I want one column with 11 rows.
Thanks
Ronai
f[x_,b_]:=2x+b;Plot[{f[x,0],f[x,1],f[x,2],f[x,3],f[x,4],f[x,5],f[x,6],f[x,7],f[x,8],f[x,9],f[x,10]},{x,0,2},PlotStyle->{Black,Blue,Red,Orange,Green,Blue,Green,Black,Red,Orange,Black},PlotLegends->Placed[LineLegend[{"0", "1","2","3","4","5","6","7","8","9","10"},Joined->Automatic,LegendFunction->Frame,LegendMarkerSize -> {{25, 5}}], {{2, 1}, {1, 1}}]]
