Message Boards Message Boards

0
|
3596 Views
|
8 Replies
|
4 Total Likes
View groups...
Share
Share this post:

[solved] Define x-range for Series expantion

Posted 12 years ago
Hi all,

I am pretty new (i.e. 2 days old) with Mathematica and so far enjoy the power of it.

My question is how-to make a series expantion for a certain x-range of the function.
The problem is that my function has quite some curves and I want to series expand in a local minimum of the function to know the curvature of this local minimum.
Imagine a Sin series and you only want to series expand in a local minimum - this is exactly the same problem.

I assume I can expand another function which is defined only in an interval around the local minimum of the orignal function ? But isn`t there a nice solution to this problem ? 

Best!

PS: The assumption argument would be nice to use but this is not the same as defining a range.
POSTED BY: simonvgorp
8 Replies
If possible, can you give an example of the kind of series expansion you are looking for from an example function?

Please take a look at the Series function if you have not already.
POSTED BY: Sean Clarke
Posted 12 years ago
The function I have is the one in this figure. This function needs to be series expanded at a=-0.15 m. BUT the range of the series expantion is important. I only want to series expand between -0.18 and -0.12, to get the exact curvature of the (almost)  ~x^2 well. I had a look in the Series function description already but there is no such thing as boundaries on a series expantion. I assume it is possible though ? Otherwise my strategy would be to define a new function only defined in this interval and then series expand this but this sounds like a detour. You got a better ideas, Sean ?

POSTED BY: simonvgorp
I'm not sure I understand what you mean by boundaries in this case. It sounds like you want to use the Series function and only apply it over a certain range of values.

A better question to ask is, how would you go about doing what you want by hand for a simple example?
POSTED BY: Sean Clarke
Taylor Expansions are defined at a point, not over a range. the higher the order of the polynomial, the wider the range it will fit...
POSTED BY: Sander Huisman
Posted 12 years ago
Hi Simon,

Series[] can expand about any point in the domain of the function. The second order term is then the second derivative divided by 2!. This is often a good aproximation to the curvature. This may be what you have in mind:

Output has been deleted, but the code should execute.
 (* define a function *)
 y[x_] := (x - 2) (x - 3) (x - 4)
 
 (* plot it *)
 Plot[y[x], {x, 1, 5}]
 
 (* choose an initial value to find a minimum *)
 x0 = x /. FindMinimum[y[x], {x, 3}][[2, 1]]
 
(* series expand about the minimum *)
expansion = Series[y[x], {x, x0, 2}]

(* select the coefficient on the 2nd order term
and mulitply be 2 since it was divided by 2! in the expansion *)
term3 = expansion[[3, 3]]; curvature = 2 term3

(* but this is just 2nd derivative at x0, which is a good approximation to the curvature *)
kApp = y''[x0]

(* formally, the curvature can be obtained as below *)

k = y''[x0]/(1 + y'[x0])^(3/2)

(* Since x0 is a min, we know y'[x0]=0, so they don't match only because of numerical error. *)
kApp - k
POSTED BY: David Keith
Explore Wolfram Demonstrations on the subject - a lot of free code to download and nice looking applications. For example:

Taylor Polynomials by Harry Calkins
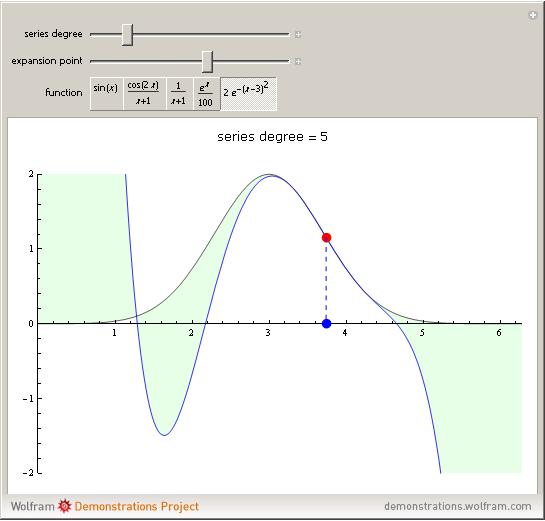


 Manipulate[
  Column[{Style[Row[{"series degree = ", deg}], "Label", 12],
    Plot[Evaluate@{func /. x -> t,
       MakeSeriesFunction[func, x, deg, pt]}, {t, 0, 2 Pi},
     PlotRange -> {{0, 2 Pi}, {-2, 2}},
     PlotStyle -> {{GrayLevel[.25, .85]}, {RGBColor[0, 0, .9, .8]}},
     Filling -> {1 -> {{2}, Directive[{Opacity[.1], Green}]}},
     Epilog -> {Red, PointSize[.02], Point[{pt, func /. x -> pt}],
       Blue, Point[{pt, 0}], Dashing[{.01}],
      Line[{{pt, func /. x -> pt}, {pt, 0}}]},
    ImageSize -> {500, 350}]}, Center], {{deg, 10, "series degree"},
  1, 24, 1}, {{pt, 0, "expansion point"}, 0,
  2 Pi}, {{func, Sin[x],
   "function"}, {Sin[x] -> TraditionalForm[Sin[x]],
   Cos[x*2]/(x + 1) -> TraditionalForm[Cos[x*2]/(x + 1)],
   1/(1 + x) -> TraditionalForm[1/(1 + x)],
   E^x/100 -> TraditionalForm[E^x/100],
   2 E^-(-3 + x)^2 -> TraditionalForm[2 E^-(-3 + x)^2]}},
SaveDefinitions -> True,
Initialization :> {MakeSeriesFunction[fn_, var_, deg_, pt_] :=
    Module[{wrkfn},
     wrkfn[tt_] =
      If[Head[fn] === Symbol && fn =!= var, fn[tt], fn /. var :> tt];
      Normal@Series[wrkfn[t], {t, pt, deg}]
     ]}]
POSTED BY: Vitaliy Kaurov
Posted 12 years ago
Hi all,
Thank you all for the replys, really appreciated.

Unfortunately the correct answer still is not given but maybe because my question was not formulated correctly (?). The series expantion at a point works but I want to series expand in a point BUT only for a given range of my function (see my previous reply in this thread).  Thus I want to define this function only in a certain range and then series expand such that I do not get the negative curvature x^4 coefficient. 

I found a way around and that is exporting the plot, to an array, only copy the part of the array that I need (which is within the range) to a new array. Then fit this array with a series expantion. However this operation involves a bit of c++ and labview which has an easy series fit.  I believe an easier solution is possible with Mathematica ?

One solution I think of now is write my own fitting routine in Mathematica, assume a coefficient, calculate the mismatch between the real function and the fitted coeff in this range, guess again, etc etc... Doesn`t there exist something like this in Mathematica ? 

So to summarize:

I have a function but want to series expand  in a certain point AND a certain range. In my previous reply this would be in the range: -0.18 and -0.12.  In the other range the function should be undefined, i.e. I do not care how the series expantion is done outside of this range. 

Is it really not possible to do this in Mathematica ?
EDIT: I`ve uploaded the mathematica file here: https://svangorp.web.cern.ch/svangorp/MaMa_forum.nb The question is thus how to get a series expantion such that expantion is ONLY in the range 0.12 to 0.18
POSTED BY: simonvgorp
Posted 12 years ago
Actually the answer is pretty straightforward:

If you want to series expand only over a range you first define a new data-set of the fit and then you FIT this dataset with a series expantion. Like this:
data[R_] = Table[{x, myPot2[R, x]}, {x, -0.02, .02, 0.002}];
fit[R_, x_] = Fit[data[R], {x^0, x^1, x^2, x^3, x^4, x^6}, {x}] ;
In this example -0.02 to 0.02 is the range over which you want to fit and myPot2[R,x] is the function.
POSTED BY: simonvgorp
Reply to this discussion
Community posts can be styled and formatted using the Markdown syntax.
Reply Preview
Attachments
Remove
or Discard

Group Abstract Group Abstract