Thanks for your reply Sander, I played with your idea and got it to work to an extent, it just didn't have everything to display all I needed. Regarding the input, it is self contained. The program first calculates all Pythagorean Triangles with a hypotenuse less than 1000. this bit {q, 5, 1000}. The remainder upto the graphic section looks for 4 PT's that share 2 sides each, such that the right angled corners can be plotted at a point. It also sorts out similar and non similar triangles.
Thanks also to Vitaliy, I was able to pick out the required bits from your code and include them into mine with success. What took a litte time to sort out were the order of plotting points so that previous points were not overdrawn by the next triangle, and also finding a scaling factor such that all looked equal regardless of the size of triangles. I have included a cut down version that only plots the first non similar triangles.
Clear[x, y, q, p]; list =
Reap[Do[p =
Solve[x^2 + y^2 == q^2 && x > 0 && y > 0 && x < y, {x, y},
Integers]; p = {x, y} /. p; k = Total@Flatten[p];
If[k > 0,
Sow[Partition[Riffle[Flatten[p], q, {3, -1, 3}], 3]]], {q, 5,
1000}]]; list = Flatten[list[[2]], 2]; lst =
SortBy[list, {#[[1]], #[[2]]} &]; ml = Max[lst[[All, 1]]]; flist =
Reap[Do[g = Select[lst, #[[1]] == y &];
Do[If[Length[g] >= 2, j = Select[lst, #[[1]] == g[[q, 2]] &]];
k = Select[lst, #[[1]] == g[[w, 2]] &];
If[Length[j] < 1 || Length[k] < 1, Continue[]]; j1 = Flatten[j];
k1 = Flatten[k]; m = Take[j1, {2, -1, 3}];
m1 = Take[k1, {2, -1, 3}]; m2 = FromDigits[Intersection[m, m1]];
r = Select[j, #[[2]] == m2 &]; t = Select[k, #[[2]] == m2 &];
If[Length[r] > 0, Sow[{g[[q]], g[[w]], r, t}]], {q, 1,
Length[g]}, {w, q + 1, Length[g]}], {y, 15,
ml}]]; nflist = {}; flist =
Partition[Flatten[flist[[2]]], 12]; simt =
Reap[Do[If[
flist[[q, 2]]/flist[[q, 1]] == flist[[q, 11]]/flist[[q, 10]],
Sow[flist[[q]]], AppendTo[nflist, flist[[q]]]], {q, 1,
Length[flist]}]]; simt = Flatten[simt[[2]], 1]; Do[
AppendTo[simt[[q]],
simt[[q, 3]] + simt[[q, 6]] + simt[[q, 9]] + simt[[q, 12]]], {q, 1,
Length[simt]}]; Do[
AppendTo[nflist[[q]],
nflist[[q, 3]] + nflist[[q, 6]] + nflist[[q, 9]] +
nflist[[q, 12]]], {q, 1, Length[nflist]}]; nflist =
SortBy[nflist, #[[13]] &]; simt =
SortBy[simt, #[[13]] &]; Print["Number of non similar triangles is ",
Length[nflist]]; Do[
Print[Grid[Partition[nflist[[q]], 3, 3, 1, {}], Alignment -> Left,
Frame -> All, Spacings -> {1, 1}]]; dp = nflist[[q, 8]]/25;
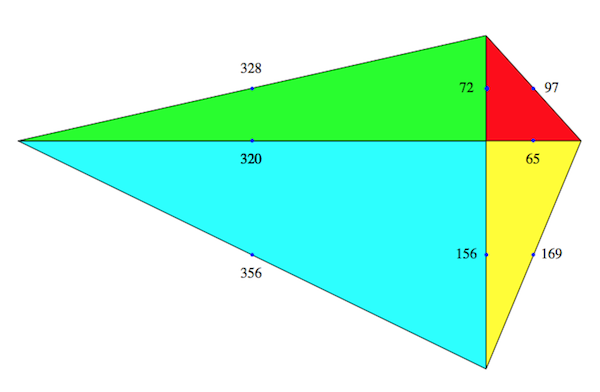
Print[Graphics[{EdgeForm[Black], Red,
Polygon[{{0, 0}, {nflist[[q, 1]], 0}, {0,
nflist[[q, 2]]}}], {Blue, PointSize[Medium],
Point[{nflist[[q, 1]]/2, 0}]}, {Blue, PointSize[Large],
Point[{0, nflist[[q, 2]]/2}]}, {Blue, PointSize[Medium],
Point[{nflist[[q, 1]]/2, nflist[[q, 2]]/2}]},
Text[Style[nflist[[q, 3]], Black, 17], {nflist[[q, 1]]/2 + dp,
nflist[[q, 2]]/2}], EdgeForm[Black], Yellow,
Polygon[{{0, 0}, {nflist[[q, 1]],
0}, {0, -nflist[[q, 5]]}}], {Blue, PointSize[Medium],
Point[{nflist[[q, 1]]/2, 0}]},
Text[Style[nflist[[q, 1]], Black,
17], {nflist[[q, 1]]/2, -dp}], {Blue, PointSize[Medium],
Point[{0, -(nflist[[q, 5]]/2)}]}, {Blue, PointSize[Medium],
Point[{nflist[[q, 1]]/2, -(nflist[[q, 5]]/2)}]},
Text[Style[nflist[[q, 6]], Black,
17], {nflist[[q, 1]]/2 + dp, -(nflist[[q, 5]]/2)}],
EdgeForm[Black], Cyan,
Polygon[{{0, 0}, {-nflist[[q, 8]],
0}, {0, -nflist[[q, 5]]}}], {Blue, PointSize[Medium],
Point[{0, -(nflist[[q, 5]]/2)}]},
Text[Style[nflist[[q, 5]], Black,
17], {-dp, -(nflist[[q, 5]]/2)}], {Blue, PointSize[Medium],
Point[{-(nflist[[q, 8]]/2), 0}]},
Text[Style[nflist[[q, 8]], Black,
17], {-(nflist[[q, 8]]/2), -dp}], {Blue, PointSize[Medium],
Point[{-(nflist[[q, 8]]/2), -(nflist[[q, 5]]/2)}]},
Text[Style[nflist[[q, 12]], Black,
17], {-(nflist[[q, 8]]/2), -(nflist[[q, 5]]/2) - dp}],
EdgeForm[Black], Green,
Polygon[{{0, 0}, {-nflist[[q, 8]], 0}, {0,
nflist[[q, 2]]}}], {Blue, PointSize[Medium],
Point[{0, nflist[[q, 2]]/2}]},
Text[Style[nflist[[q, 2]], Black, 17], {-dp,
nflist[[q, 2]]/2}], {Blue, PointSize[Medium],
Point[{-(nflist[[q, 8]]/2), 0}]},
Text[Style[nflist[[q, 8]], Black,
17], {-(nflist[[q, 8]]/2), -dp}], {Blue, PointSize[Medium],
Point[{-(nflist[[q, 8]]/2), nflist[[q, 2]]/2}]},
Text[Style[nflist[[q, 9]], Black, 17], {-(nflist[[q, 8]]/2),
nflist[[q, 2]]/2 + dp}]}, ImageSize -> {700, 700}]];
Print[], {q, 1, Length[nflist]}]
Thanks again for your quick replies and sorry i was late in replying.
Paul.


