Message Boards Message Boards

Test time series structural break and breakpoints?

Posted 6 years ago

Hi all,

I would like to investigate a financial index time series. From the observation, I notice that there might be one or multiple structural breaks embedded in the time series.

Is there a way for Mathematica to detect those structural breaks and the breakpoints? I used to use Eviews for analysis but now want to transform my workflow to Mathematica. I would appreciate it if someone can provide me the hint.

Best,

Tuoyi

POSTED BY: Jason Zhao
8 Replies

Tuoyi,

If I understand what you are trying to do, I would use Differences to find the jump:

DateListPlot[Differences[ts], PlotRange -> All]

to get the break at the peak
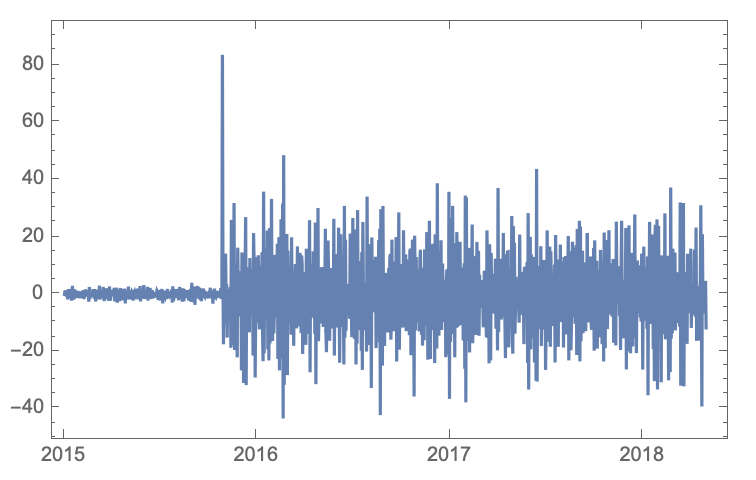
enter image description here

If the noise is a problem you can filter it: (in this case with a 10 day filter)

filt = MeanFilter[ts, 3600*24*10]
DateListPlot[{ts, filt}]
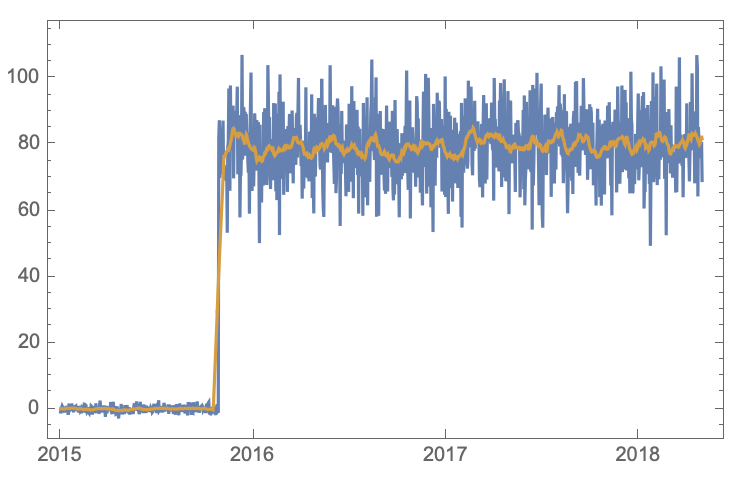
enter image description here ListLinePlot[Differences[filt], PlotRange -> All]
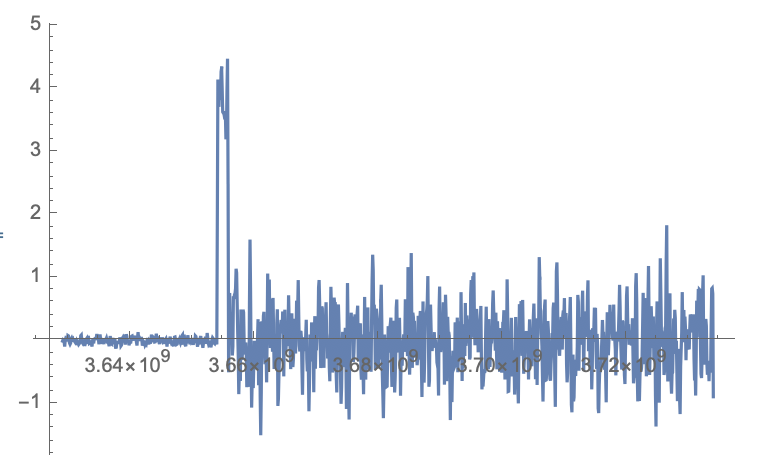
enter image description here

Now you have a more distinctive break (peak). There are many ways to find the peaks depending on exactly what you are trying to do. I hope this helps.

Regards,

Neil

POSTED BY: Neil Singer
Posted 5 years ago

Hi all, for anyone who is interested in this topic. You can now refer to this excellent post.

POSTED BY: Jason Zhao

A concrete numerical example would be quite useful.

POSTED BY: Daniel Lichtblau
Posted 6 years ago

For example, the Bitcoin price data which is easy to obtained. In different periods of time, the series illustrates different behaviors. I can determine at least two breakpoints for the whole time series in Eviews. Can I do the same thing in Mathematica in a straightforward way?

POSTED BY: Jason Zhao

To paraphrase an old quote, There's nothing like a concrete example. And that was nothing like a concrete example.

A (not too small) list of representative {x,y} values would make for a concrete example.

POSTED BY: Daniel Lichtblau
Posted 6 years ago

I do not have access to Eviews on my personal Mac, or else, I'm able show you screenshots of structural break test result by Eviews. However, I just generate some random numbers from normal distribution and combine them together, from which you can obviously notice a jump from graph. Can Mathematica detect that structural break and determine the time of that breakpoint?

https://www.wolframcloud.com/objects/81e17497-e6e3-4b1f-b11f-7576d400ec59

POSTED BY: Jason Zhao
Posted 6 years ago

I would expect the result similar to this one Working With Breakpoint Equations with automatic calculation to numbers of breakpoints and places where breakpoints are.

POSTED BY: Jason Zhao
Posted 6 years ago

Hi Neil,

Thank you so much for your answer.

Your solution works well on my sample data, but the case is that my sample data does only contain one innovation on mean. However, for the real world case, such as Bitcoin price data, there might be a combination of innovations on many parameters, and the underlying distribution in each period may vary as well (ARMA + Random Walk + AR, with two structural breaks, for example).

I create a different time series, which simply combines two AR(1) process, but with different parameters. Then the structural break is not that obvious. https://www.wolframcloud.com/objects/7dd2812d-1b12-47bf-a1e8-d48303fe28cd

So, I just wonder, does mathematica have a universal (or partly universal) way/function to detect structural break? Just as Chow test or Bai-Perron test.

Best,

Tuoyi

POSTED BY: Jason Zhao
Reply to this discussion
Community posts can be styled and formatted using the Markdown syntax.
Reply Preview
Attachments
Remove
or Discard

Group Abstract Group Abstract