Tuoyi,
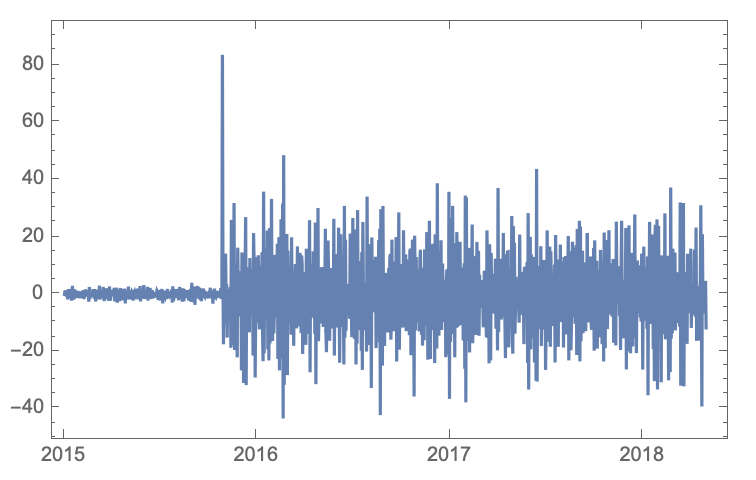
If I understand what you are trying to do, I would use Differences to find the jump:
DateListPlot[Differences[ts], PlotRange -> All]
to get the break at the peak

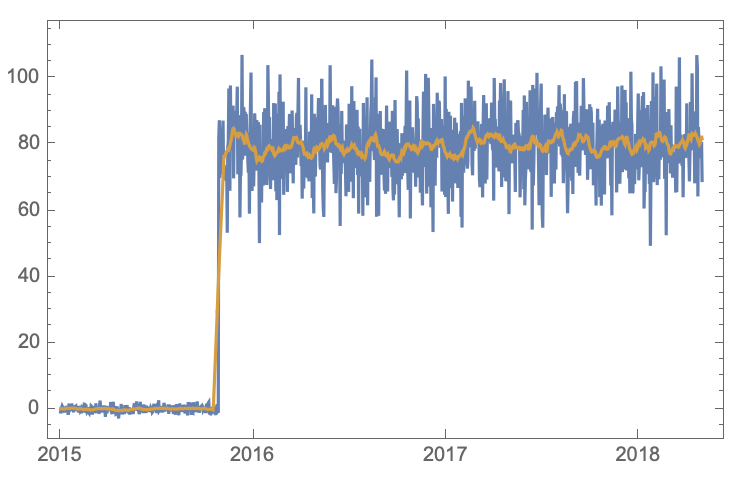
If the noise is a problem you can filter it: (in this case with a 10 day filter)
filt = MeanFilter[ts, 3600*24*10]
DateListPlot[{ts, filt}]
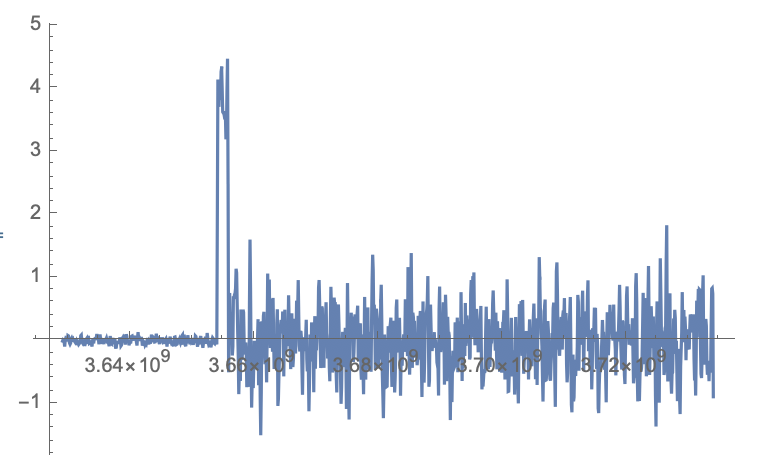
 ListLinePlot[Differences[filt], PlotRange -> All]

Now you have a more distinctive break (peak). There are many ways to find the peaks depending on exactly what you are trying to do. I hope this helps.
Regards,
Neil