Message Boards Message Boards

0
|
3251 Views
|
3 Replies
|
1 Total Likes
View groups...
Share
Share this post:

Edit specific parts of vector fields?

I would like to take a specific part of a given vector field, and make all the vectors bold. For example, I want to take the {x, y} vector field, and make all the vectors from x=0 to x=10 to be bold, and the rest of the field to be regular. I would appreciate it if anyone could help me figure this out!

POSTED BY: Hafez Rais
3 Replies

Hafez,

You should post an example so people can help you more easily. I grabbed one of the examples to demonstrate.

One way to highlight is with color functions: (note that VectorColorFunctionScaling must be false to get the color you specify)

VectorPlot[{y, -x }, {x, -3, 3}, {y, -3, 3}, VectorScale -> Large, 
 VectorColorFunction -> 
  Function[{x, y, vx, vy, n}, 
   If[x <= 1.5 || Abs[y] >= 1, Black, Red]], 
 VectorColorFunctionScaling -> False]

To get

enter image description here

to make them bold use VectorScale's function option: (note scale value is between 0 and 1, or it will autoscale)

VectorPlot[{y, -x }, {x, -3, 3}, {y, -3, 3}, 
 VectorScale -> {Large, Automatic, 
   If[#1 <= 1.5 || Abs[#2] >= 1, 0.3, 0.8] &}]

To get:

enter image description here

You can further adjust the options to get what you want.

Regards,

Neil

POSTED BY: Neil Singer
Posted 5 years ago

Thank you so much Neil! I'm really new to Mathematica. Still getting used to all the syntax and different things. On the same thing: Is there any way I can change the vectors that are in a specific angle to bold? And in the examples that you posted, when we make the vectors to larger scale, it only tends to make the head of the arrow bigger, instead of thickening them. Any ideas on how to change the whole thickness? Hafez

POSTED BY: Updating Name

Hafez,

The color function and the scale function both get 5 arguments: x, y, vx, vy, Norm[{vx, vy}] from these inputs you can calculate angle or any other value. For example, the vector angle would be ArcTan[vx,vy]

As to the line thickness you can specify the thickness (and many other attributes) with

VectorStyle -> Thickness[.01]

I do not see how you can specify the vectorStyle in one plot based on a function, however, You can use the RegionFunction to plot your vectors in different regions with different attributes.

Here is an example:

one = VectorPlot[{y, -x }, {x, -3, 3}, {y, -3, 3}, 
   VectorScale -> Medium, 
   RegionFunction -> 
    Function[{x, y, vx, vy, n}, x <= 1.5 || Abs[y] >= 1]];
two = VectorPlot[{y, -x }, {x, -3, 3}, {y, -3, 3}, 
   VectorScale -> Large, 
   RegionFunction -> 
    Function[{x, y, vx, vy, n}, Not[x <= 1.5 || Abs[y] >= 1]], 
   VectorStyle -> {Thickness[0.01], Red}];
Show[{one, two}]

to get a region with thick, red vectors and thin blue vectors everywhere else.
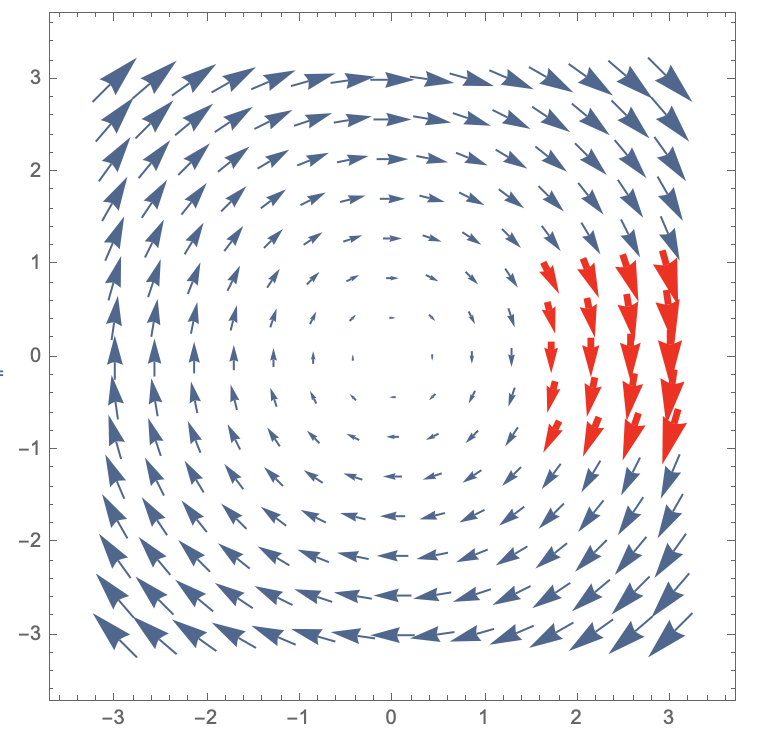
enter image description here

POSTED BY: Neil Singer
Reply to this discussion
Community posts can be styled and formatted using the Markdown syntax.
Reply Preview
Attachments
Remove
or Discard

Group Abstract Group Abstract