Hafez,
The color function and the scale function both get 5 arguments: x, y, vx, vy, Norm[{vx, vy}] from these inputs you can calculate angle or any other value. For example, the vector angle would be ArcTan[vx,vy]
As to the line thickness you can specify the thickness (and many other attributes) with
VectorStyle -> Thickness[.01]
I do not see how you can specify the vectorStyle in one plot based on a function, however, You can use the RegionFunction to plot your vectors in different regions with different attributes.
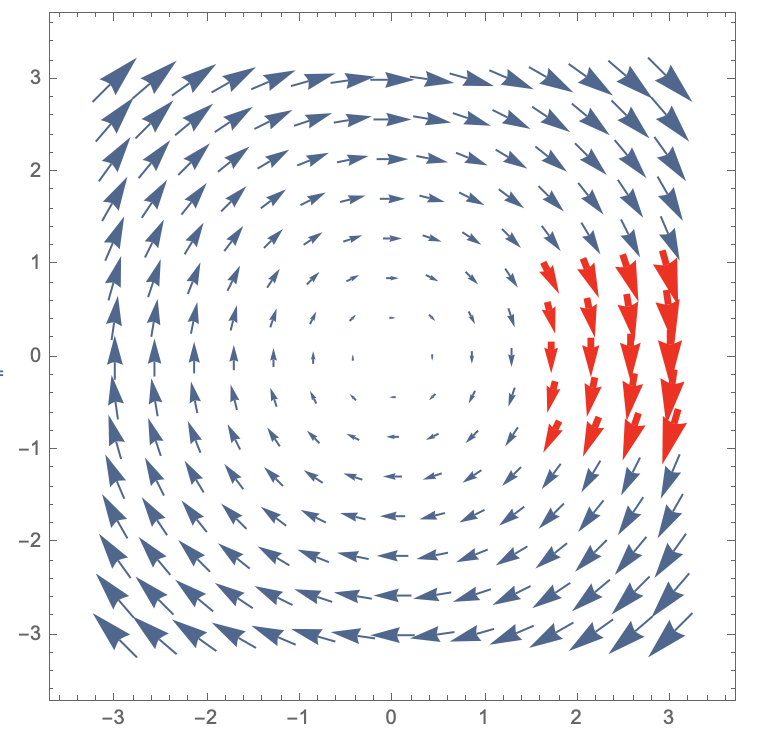
Here is an example:
one = VectorPlot[{y, -x }, {x, -3, 3}, {y, -3, 3},
   VectorScale -> Medium,
   RegionFunction ->
    Function[{x, y, vx, vy, n}, x <= 1.5 || Abs[y] >= 1]];
two = VectorPlot[{y, -x }, {x, -3, 3}, {y, -3, 3},
   VectorScale -> Large,
   RegionFunction ->
    Function[{x, y, vx, vy, n}, Not[x <= 1.5 || Abs[y] >= 1]],
   VectorStyle -> {Thickness[0.01], Red}];
Show[{one, two}]
to get a region with thick, red vectors and thin blue vectors everywhere else.