A public display of Eating your own dog food can be educational. Starting from the post by J.M. above, we can extract the Legend colours from the FullForm of the final plot. We test these as below:
SwatchLegend[{RGBColor[1.`, 0.92`, 0.5`],
  RGBColor[1.`, 0.6688982203952127`, 0.24889822039521264`],
  RGBColor[0.8933132970930611`, 0.34531930796514276`, 0.`] ,
  RGBColor[0.7`, 0.21`, 0.`]}, {"0 \[Degree]C", "1 \[Degree]C",
  "2 \[Degree]C", "3 \[Degree]C"}, LegendFunction -> "Frame",
 LegendLabel -> "Temp, \[Degree]C"]
We will need the bounding box for the continental states.
{{latmin, latmax}, {lonmin, lonmax}} =
 GeoBounds[
  EntityClass["AdministrativeDivision", "ContinentalUSStates"]]
Next add the state centroids to the Association. The list continentalStates was defined in the post by J.M. above.
Map[(gwData[#] =
    Flatten[{ GeoPosition[#][[1]],
      gwData[#]}]) &, continentalStates] ;    (* remap the gwData
Association so each element contains the centroid's latitude,longitude,temperature. *)

 GeoGraphics[ GeoMarker /@ Normal[gwData ][[All, 2, {1, 2}]]  ,
  GeoRange -> {{latmin, latmax}, {lonmin, lonmax}},
 GeoRangePadding -> None]  (* plot the state centroids *)

{Min[Normal[gwData ][[All, 2]]  [[All, 3]]]
 , Max[Normal[gwData ][[All, 2]]  [[All,
    3]]]} (* this is the range of temperature changes in the data *)
We have temps outside the range used in the above plot's Legend.
So we may have to extend our Legend because DensityPlot may clip. We add another legend value.
SwatchLegend[{RGBColor[1.`, 0.92`, 0.5`],
  RGBColor[1.`, 0.6688982203952127`, 0.24889822039521264`],
  RGBColor[0.8933132970930611`, 0.34531930796514276`, 0.`] ,
  RGBColor[0.7`, 0.21`, 0.`],
  RGBColor[0.5`, 0.1`, 0.`]}, {"0 \[Degree]C", "1 \[Degree]C",
  "2 \[Degree]C", "3 \[Degree]C", "4 \[Degree]C"},
 LegendFunction -> "Frame", LegendLabel -> "Temp, \[Degree]C"]
We create an Interpolation function f that accepts {long,
lat} values and returns temperatures.
f = Interpolation[
  Map[{{#[[2]], #[[1]]}, #[[3]]} &, Normal[gwData ][[All, 2]] ],
  InterpolationOrder ->
   1] (* we have to reverse {lat,long} order in argument list to get \
sensible alignment of the plot *)

region =
 Rectangle[{lonmin, latmin}, {lonmax,
   latmax} ] ; (* define a Region that includes all the continental \
states. Use this to define the DensityPlot *)

   plot = DensityPlot[ f[u, v] , {u, v} \[Element] region,
     ColorFunctionScaling -> False,
     ColorFunction -> (Blend[ {{0, RGBColor[1.`, 0.92`, 0.5`]}, {1,
           RGBColor[1.`, 0.6688982203952127`, 0.24889822039521264`]}, {2,
            RGBColor[0.8933132970930611`, 0.34531930796514276`,
            0.`]} , {3, RGBColor[0.7`, 0.21`, 0.`]},
          {4, RGBColor[0.5`, 0.1`, 0.`]}}, #] &),
      Frame -> False, AspectRatio -> 1, PlotRangePadding -> None,
     ImagePadding -> None, PlotRange -> All]  (* remove labels and axes *)
Rasterize this plot and insert it as a GeoImage into a GeoGraphics.
 pp = GeoGraphics[{GeoStyling[{"GeoImage",
      Rasterize[  plot, RasterSize -> 200]}], EdgeForm[Thin],
    Polygon[Entity["Country", "UnitedStates"]]},
   PlotLabel -> "Temperature Rise Over 100 Years",
   Epilog -> {Inset[
      SwatchLegend[{RGBColor[1.`, 0.92`, 0.5`],
        RGBColor[1.`, 0.6688982203952127`, 0.24889822039521264`],
        RGBColor[0.8933132970930611`, 0.34531930796514276`, 0.`] ,
        RGBColor[0.7`, 0.21`, 0.`],
        RGBColor[0.5`, 0.1`, 0.`]}, {"0 \[Degree]C", "1 \[Degree]C",
        "2 \[Degree]C", "3 \[Degree]C", "4 \[Degree]C"},
       LegendFunction -> "Frame",
       LegendLabel -> "Temp, \[Degree]C"] , {Right, Bottom}, {Right,
       Bottom}]}]  ;
states = GeoGraphics[ {GeoStyling[Opacity[0]], EdgeForm[Thin],
    Polygon[EntityClass["AdministrativeDivision",
      "ContinentalUSStates"]]}, GeoBackground -> "CountryBorders"]  ;
Show[pp, states] (* add state boundaries to the Density plot *)
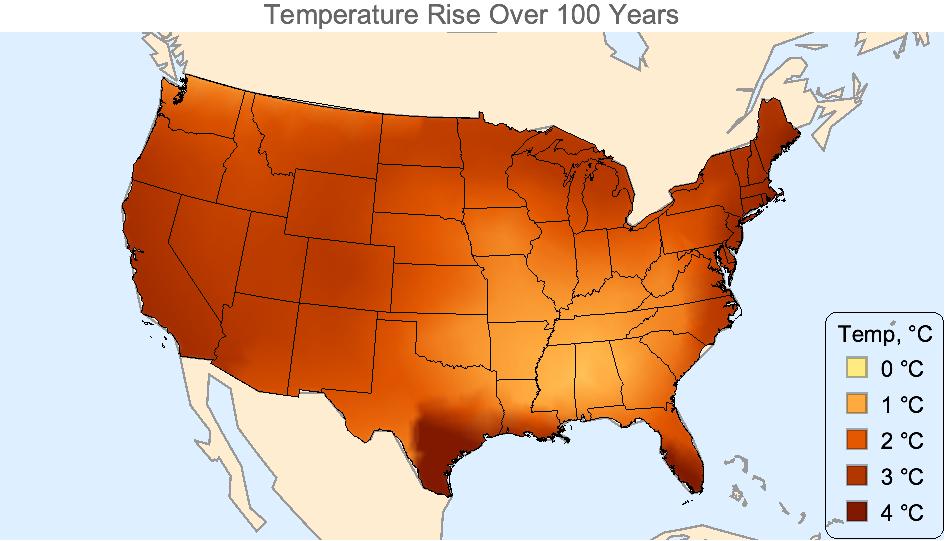
I do not fully understand GeoStyling[{"GeoImage", ...}] so am
guessing that the Interpolation function has invented the hot spot on
the Texas Gulf coast because
extrapolation was used (south and east of the centroid).
In California, I don' t know what happened, except California
appears cooler than it should be.
So although very pretty, this map is even more nonsensical than the
original (where climate obeyed state boundaries), and demonstrates
that Interpolation outside the convex hull of the state centroids is
dangerous. We need more data points.


