Please download the attached notebook for the complete demo
The work in this discussion is inspired by the SE link and a domestic user's question on how to construct the following plot from Wolfram Language:
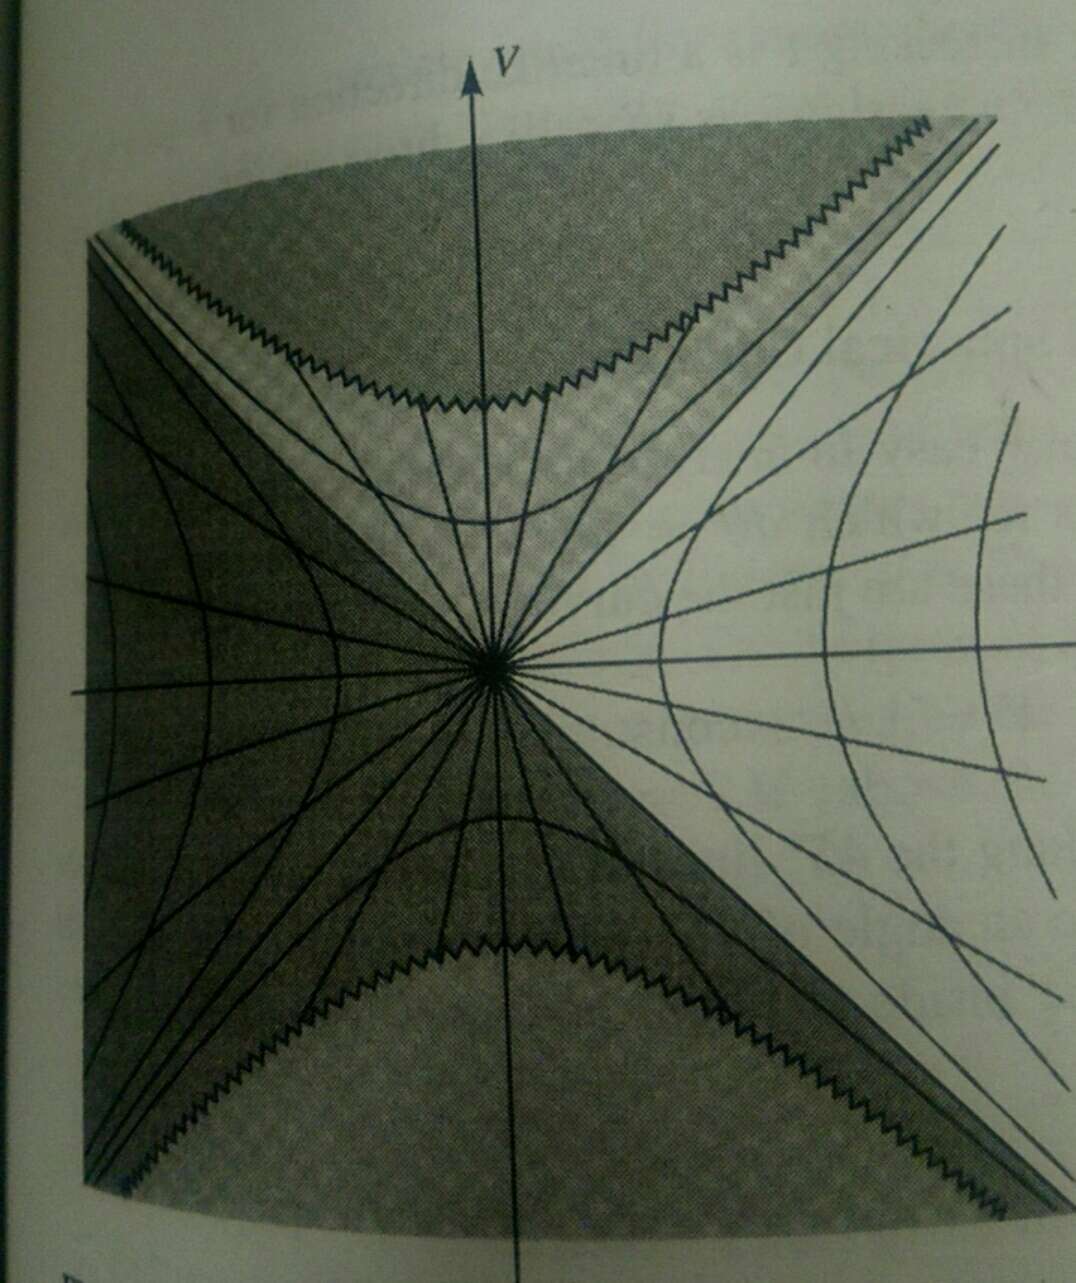
This graph is composed of several sections
- Top and bottom dome
- Dark region on the left and lower part
- Zigzaged contour/boudary for the dome
- Light colored region on the left with triangular boundary
- Light colored region on the middle with triangular boundary, pointing upward
- Mesh lines
- A bunch of rays shooting from the origin
If you plot the sections separatedly and put everything in the right order in terms of graphical layer,
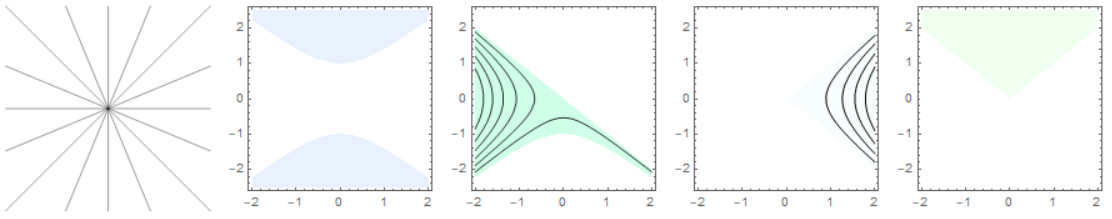
you have a futuristic and stylish plot below with Epilog -> ZigZagLine in the final Show function:
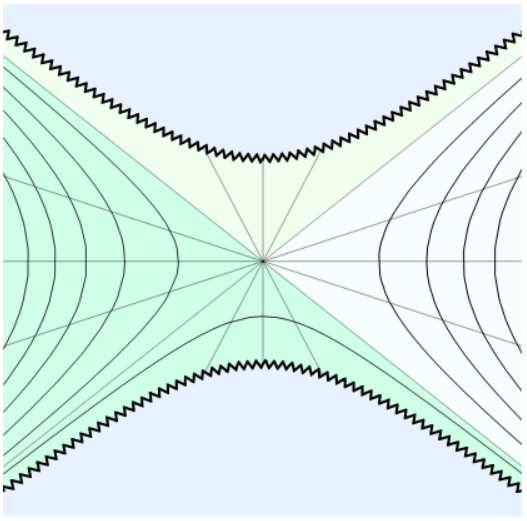
Chromatists can suggest a better palette something like Chanel's Morandi scheme:

Here is how to draw the zig zag lines (other components are not discussed here):
Please find the Spring[...] function in the attached notebook or here. I have modified the SE version to reduce the lines produced when the end length of a spring is set to zero. Quickly test on the example:
 pts1 = 2*{{-1, 0}, {0, 1}, {1, 0}, {0, -1}, {-1, 0}};
 pts2 = ConstantArray[{4, 0}, 5] + pts1;
 Graphics[{
   Line[pts1], Line[pts2],
   spring[pts1[[2]], pts2[[2]]][[1]],
   spring[pts1[[4]], pts2[[4]]][[1]]
   }]
To draw a spring curve for a curve with closed form solution, say a parabola, You can use the following procedure. The key steps are
Team up the point and its neighbour on the right, resulting Length[pts3] - 1 tuples:
 pts3 = Table[{t, t^2}, {t, -1, 1, 0.08}];
 tuples = Partition[pts3, 2, 1];
Connect two points on the parabola with spring in between. Flatten the list of lines and join all points in a list:
final = Map[(spring[#[[1]], #[[2]], 3, 0.02, 0][[1, 1]]) &, tuples];
Plot[-t^2, {t, -1, 1},
 Epilog ->
  Line[Flatten[Cases[final, _Line, Infinity] /. Line -> Identity, 1]],
 PlotRange -> {-1, 1}, AspectRatio -> 0.8*GoldenRatio]
For implicity function like hyperbola, you can do the following to extract the points on curve:
line1 = Table[{x,
    y /. FindRoot[y^2 - x^2 - 1 && y > 0, {y, 1}]}, {x, -2, 2, 0.2}];
line2 = line1 /. {{a_, b_} :> {a, -b}};
 Attachments:


