I continue to investigate this, and I don't seem to be able to find any workaround. Nothing works as I would expect. I have tried setting ColorFunctionScaling->True, and setting my thresholds to the resulting normalised values, but this gives incomprehensible results--for example, even though all values are positive and I set the threshold at 0, they are all coloured red as if below the threshold.
Other bizarre behaviour...
Trying a different approach to defining a ColorFunction using Hue (not useful for my intended purpose but just testing the performance of this function)...
GeoRegionValuePlot[{Entity[
    "City", {"London", "GreaterLondon", "UnitedKingdom"}] -> 0.1,
  Entity["City", {"Paris", "IleDeFrance", "France"}] -> 0.4,
  Entity["City", {"Berlin", "Berlin", "Germany"}] -> 0.7},
 ColorFunctionScaling -> False, ColorFunction -> Function[u, Hue[u]]]

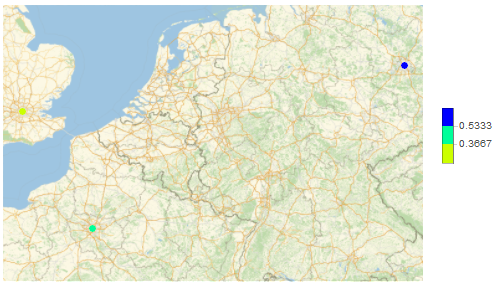
Looks feasible. I then change the value of London, which should not change the colours of the other two cities, since their values do not change, but in fact it does.
GeoRegionValuePlot[{Entity[
    "City", {"London", "GreaterLondon", "UnitedKingdom"}] -> 0.2,
  Entity["City", {"Paris", "IleDeFrance", "France"}] -> 0.4,
  Entity["City", {"Berlin", "Berlin", "Germany"}] -> 0.7},
 ColorFunctionScaling -> False, ColorFunction -> Function[u, Hue[u]]]
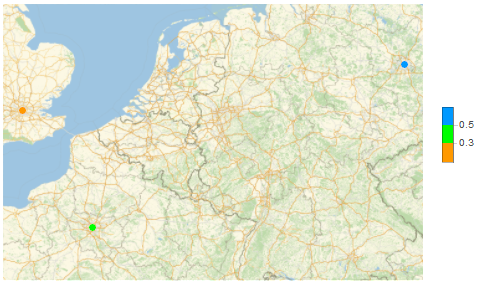
This gives...

I think, maybe it is acting as though ColorFunctionScaling is True (even though I set it to false). In this case, changing the value of London changes the minimum value, which affects the scaling. So I try changing the value for Paris, which is between the extremes. In this case, it looks as though the ColorFunction is behaving in some quantised way, even though it ought to be continuous.
With Paris changed to 0.3
GeoRegionValuePlot[{Entity[
    "City", {"London", "GreaterLondon", "UnitedKingdom"}] -> 0.1,
  Entity["City", {"Paris", "IleDeFrance", "France"}] -> 0.3,
  Entity["City", {"Berlin", "Berlin", "Germany"}] -> 0.7},
 ColorFunctionScaling -> False, ColorFunction -> Function[u, Hue[u]]]
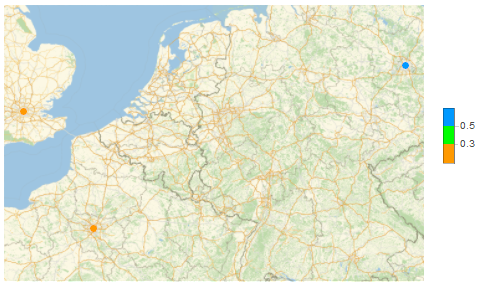
I get the following, where Paris is now coloured the same as London...

And if I change Paris to 0.5...
GeoRegionValuePlot[{Entity[
    "City", {"London", "GreaterLondon", "UnitedKingdom"}] -> 0.1,
  Entity["City", {"Paris", "IleDeFrance", "France"}] -> 0.5,
  Entity["City", {"Berlin", "Berlin", "Germany"}] -> 0.7},
 ColorFunctionScaling -> False, ColorFunction -> Function[u, Hue[u]]]
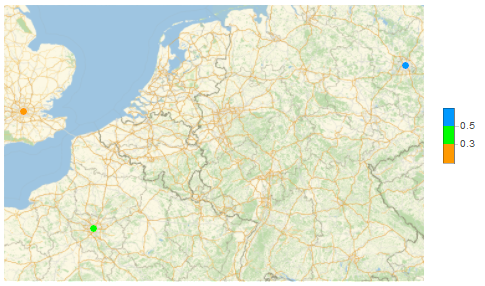
I get the following, where Paris seems to be coloured the same as when its value is 0.4 (even though Hue[0.5] ought to look different from Hue[0.4]...

I'm beginning to think that ColorFunction within GeoRegionValuePlot got broken somewhere between Mathematica 10 and Mathematica 11.3, with no logical explanation or workaround, and so it is now impossible to achieve what I want..?