Group Abstract Group Abstract

Message Boards Message Boards

Issue with ColorFunction in GeoRegionValuePlot?

Posted 7 years ago
POSTED BY: Marc Widdowson
12 Replies
Posted 5 years ago
POSTED BY: Dave Middleton
Posted 5 years ago

I am seeing a similar issue. I am using Mathematica 12.2.0.0 on Mac OS10.15.7. Is this still a bug? Is there a solution besides mapping the data as shared by Marc (above)? P.S. This is my first post so I'm not sure how this works...

bl = BarLegend[{palette, {0, 4}}, LabelStyle -> 10];

getColor[val2_] := ColorData["TemperatureMap", val2/4];

{getColor[.1], getColor[1], getColor[1.5], getColor[2], getColor[2.5],
  getColor[3], getColor[3.5], getColor[4]}

gPlot = <|Entity[
    "AdministrativeDivision", {"FairfieldCounty", "Connecticut", 
     "UnitedStates"}] -> Log10[10000.], 
  Entity["AdministrativeDivision", {"HartfordCounty", "Connecticut", 
     "UnitedStates"}] -> Log10[5000.], 
  Entity["AdministrativeDivision", {"LitchfieldCounty", "Connecticut",
      "UnitedStates"}] -> Log10[1000.], 
  Entity["AdministrativeDivision", {"MiddlesexCounty", "Connecticut", 
     "UnitedStates"}] -> Log10[500.], 
  Entity["AdministrativeDivision", {"NewHavenCounty", "Connecticut", 
     "UnitedStates"}] -> Log10[100.], 
  Entity["AdministrativeDivision", {"NewLondonCounty", "Connecticut", 
     "UnitedStates"}] -> Log10[50.], 
  Entity["AdministrativeDivision", {"TollandCounty", "Connecticut", 
     "UnitedStates"}] -> Log10[10.], 
  Entity["AdministrativeDivision", {"WindhamCounty", "Connecticut", 
     "UnitedStates"}] -> Log10[5.]|>

GeoRegionValuePlot[gPlot,
 ImageSize -> 400,
 PlotRange -> {0, 4},
 ColorFunction -> (getColor[#] &),
 ColorFunctionScaling -> False,
 PlotLegends -> bl,
 PlotStyle -> Directive[Opacity[.6]]]

Result

POSTED BY: Mark Firary
Posted 6 years ago
POSTED BY: Dave Middleton
Posted 7 years ago

The bug is still there in Version 12, unfortunately.

POSTED BY: Updating Name
Posted 7 years ago

Thank you very much.

POSTED BY: Marc Widdowson

I reported the bug to Support so that it will be addressed in the upcoming Version 12.

Regards,

POSTED BY: Neil Singer
Posted 7 years ago

I have not tried this in an earlier version.

I have found a workaround by first mapping the data onto their colours, then passing the new data to GeoRegionValuePlot. I.e., I do

data2 = Map[#[[1]] -> If[#[[2]] > 0, Green, Red] &, data]
GeoRegionValuePlot[data2]
POSTED BY: Marc Widdowson
Posted 7 years ago

Did [url=http://www.testlink.com/]test link[/url] you try doing this in an earlier version of the software, Marc?

POSTED BY: Cole Rothier
Posted 7 years ago

I continue to investigate this, and I don't seem to be able to find any workaround. Nothing works as I would expect. I have tried setting ColorFunctionScaling->True, and setting my thresholds to the resulting normalised values, but this gives incomprehensible results--for example, even though all values are positive and I set the threshold at 0, they are all coloured red as if below the threshold.

Other bizarre behaviour...

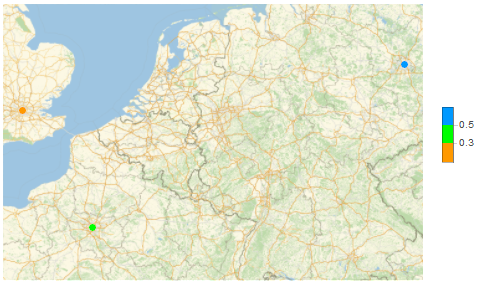
Trying a different approach to defining a ColorFunction using Hue (not useful for my intended purpose but just testing the performance of this function)...

GeoRegionValuePlot[{Entity[
    "City", {"London", "GreaterLondon", "UnitedKingdom"}] -> 0.1, 
  Entity["City", {"Paris", "IleDeFrance", "France"}] -> 0.4, 
  Entity["City", {"Berlin", "Berlin", "Germany"}] -> 0.7}, 
 ColorFunctionScaling -> False, ColorFunction -> Function[u, Hue[u]]]

GeoRegionValuePlot problem 1

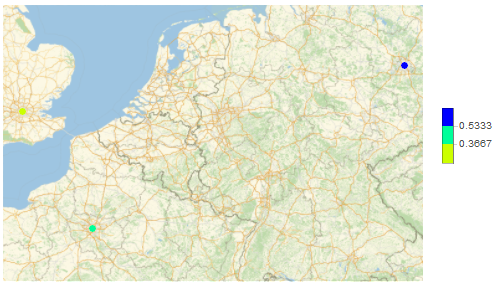
Looks feasible. I then change the value of London, which should not change the colours of the other two cities, since their values do not change, but in fact it does.

GeoRegionValuePlot[{Entity[
    "City", {"London", "GreaterLondon", "UnitedKingdom"}] -> 0.2, 
  Entity["City", {"Paris", "IleDeFrance", "France"}] -> 0.4, 
  Entity["City", {"Berlin", "Berlin", "Germany"}] -> 0.7}, 
 ColorFunctionScaling -> False, ColorFunction -> Function[u, Hue[u]]]

This gives...

GeoRevionValuePlot problem 2

I think, maybe it is acting as though ColorFunctionScaling is True (even though I set it to false). In this case, changing the value of London changes the minimum value, which affects the scaling. So I try changing the value for Paris, which is between the extremes. In this case, it looks as though the ColorFunction is behaving in some quantised way, even though it ought to be continuous.

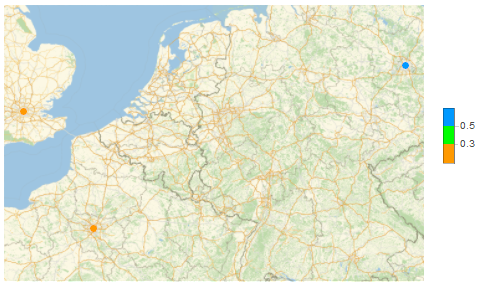
With Paris changed to 0.3

GeoRegionValuePlot[{Entity[
    "City", {"London", "GreaterLondon", "UnitedKingdom"}] -> 0.1, 
  Entity["City", {"Paris", "IleDeFrance", "France"}] -> 0.3, 
  Entity["City", {"Berlin", "Berlin", "Germany"}] -> 0.7}, 
 ColorFunctionScaling -> False, ColorFunction -> Function[u, Hue[u]]]

I get the following, where Paris is now coloured the same as London...

GeoRegionValuePlot problem 3

And if I change Paris to 0.5...

GeoRegionValuePlot[{Entity[
    "City", {"London", "GreaterLondon", "UnitedKingdom"}] -> 0.1, 
  Entity["City", {"Paris", "IleDeFrance", "France"}] -> 0.5, 
  Entity["City", {"Berlin", "Berlin", "Germany"}] -> 0.7}, 
 ColorFunctionScaling -> False, ColorFunction -> Function[u, Hue[u]]]

I get the following, where Paris seems to be coloured the same as when its value is 0.4 (even though Hue[0.5] ought to look different from Hue[0.4]...

GeoRegionValuePlot problem 4

I'm beginning to think that ColorFunction within GeoRegionValuePlot got broken somewhere between Mathematica 10 and Mathematica 11.3, with no logical explanation or workaround, and so it is now impossible to achieve what I want..?

POSTED BY: Marc Widdowson
Posted 7 years ago

I'm using Version 11.3 on Windows 8.1. I've checked with Version 11.2, and I get the same.

POSTED BY: Marc Widdowson

Hi,

I am on a Mac and if I execute:

GeoRegionValuePlot[{Entity[
    "City", {"London", "GreaterLondon", "UnitedKingdom"}] -> 334, 
  Entity["City", {"Paris", "IleDeFrance", "France"}] -> 356, 
  Entity["City", {"Berlin", "Berlin", "Germany"}] -> 399}, 
 ColorFunctionScaling -> False, 
 ColorFunction -> (If[# > 358, Green, Red] &)]

I get

enter image description here

as in the OP. I get the same if I execute that in the Wolfram Cloud.

Cheers,

Marco

POSTED BY: Marco Thiel

I'm using Version 10.1 running Windows 7. Executing code in your In[161], Paris and London were red and Berlin was green.

POSTED BY: Ed Forrester
Reply to this discussion
Community posts can be styled and formatted using the Markdown syntax.
Reply Preview
Attachments
Remove
or Discard