Message Boards Message Boards

3D visualization of the Tokyo subway system

Posted 5 years ago

Last month, a TV program "Chico Will Scold You" of Japan public broadcasting picked up the Tokyo subway. The TV show introduced the 3 D model of Tokyo subway, "Tokyo Arteria" which created by Takatsugu KURIYAMA.

I was influenced by the beauty, so I tried to make something similar with Mathematica. Because I create it using Mathematica's Tube function, I named it "Tokyo Tube". enter image description here

There are 13 subways in Tokyo. I gathered the information of latitude, longitude and depth (from the ground) of all stations (287 stations) from web and book.

I will explain on the Hanzomon line as an example. The figure on the left shows connecting stations by the shortest straight line. However, the actual route is a more complicated. The figure on the right is the result of Google Map route search.

enter image description here

The TV program explained why Tokyo's subway is so complicated. The answer is there is the law that if you buy land, you will have the right of both the ground and the underground. So it is necessary to pay the land fee to all of them to get through a subway. In order to avoid this, a subway runs under the roads owned by the state or municipality because their underground can be used free of charge for public interest purposes. In addition, the roads in Tokyo are not straight because the roads are made by filling roads and waterways that were made in a radial shape based on the Edo Castle during the Edo period.

  • From the result of Google Map route search, I search the route position using PixelValuePositions function.

enter image description here enter image description here

  • I sort the points by y - axis, latitude. So the first point is the starting station, the Shibuya Station and the last point is the terminal station, Oshiage Station. However, just connecting the sorted points does not follow the route (left figure). So, I use FindShortestTour function to rearrange according to the route, and select about 100 points from them for the Graphics3D (right figure).

    p2 = Sort[p, #1[[2]] < #2[[2]] &]; 
    s = FindShortestTour[p2, 1, Length[p2]];
    p3 = Append[
       Take [p2[[Last[s]]], {1, m = Length@Last[s], Round[m/100]}], 
       p2[[-1]]];
    {ListLinePlot[p2], ListLinePlot[p3]}
    

enter image description here

These points are converted into 3 D display based on the information of latitude, longitude and depth of all stations above. The actual map obtained by GeoGraphics function is pasted on the top surface.

enter image description here

The following is the result of carrying out this work for 13 lines.

enter image description here

The figure below shows the Ginza Line, the oldest in business, and the Oedo Line, the newest. The subway created later is deeper. And the Roppongi Station on the Oedo Line is at the deepest position 42.3 meters underground.

enter image description here

In addition, the Fukutoshin Line, which is the most recently full-opened, was created between the Marunouchi Line and the Shinjuku Line. The distance between the lines is about 11 cm at the shortest distance.

Now, the law that it can be used free of charge at a place deeper than 40 meters if it is the public interest purpose was made. The Linear Chuo Shinkansen, which digs underground straight in the urban area, will aim to open in 2027.

I have attached a notebook of Graphics3D "Tokyo Tube", so please rotate it.

Attachments:
POSTED BY: Kotaro Okazaki
5 Replies

Thanks for your fruitfull information.

Based on it, I tried to find the exact route of Hanzomon Line. Because it does not work well for a wide region, I decided to get a route between adjacent stations.

There are 14 stations on Hanzomon Line.

hanzomonStations = {{35.658517`, 139.701334`}, {35.665247`, 
    139.712314`}, {35.672765`, 139.724159`}, {35.678757`, 
    139.740258`}, {35.685703`, 139.741644`}, {35.695589`, 
    139.751948`}, {35.695492`, 139.75812`}, {35.684801`, 
    139.766086`}, {35.684888`, 139.773161`}, {35.682061`, 
    139.786035`}, {35.682105`, 139.798851`}, {35.689071`, 
    139.815651`}, {35.696437`, 139.813949`}, {35.710702`, 
    139.812935`}};
hanzomonStationsPair = Transpose /@ Partition[hanzomonStations, 2, 1];

At first, it works well between Shibuya station(1st) and Omote-sando station(2nd).

osm = ResourceFunction["OSMImport"][
   GeoBoundsRegion[hanzomonStationsPair[[1]]]];
railway = Select[osm["Ways"], KeyExistsQ[#Tags, "railway"] &]; pos = 
 Select[railway, MemberQ[#[[2]], "Tokyo Metro Hanzomon Line"] &];
GeoGraphics[{Thick, Red, 
  Line@Values@osm[["Nodes", #Nodes, "Position"]] & /@ pos}]

enter image description here

However, it doesn't work well between Omote-sando station(2nd) and Aoyama-itchome station(3rd). enter image description here

POSTED BY: Kotaro Okazaki

Nice post! I'm not sure I entirely understand how you converted the PixelValuePositions results to lat-long, but you may be interested in a function in the Function Repository called OSMImport (https://resources.wolframcloud.com/FunctionRepository/resources/OSMImport).

OSMImport lets you import GIS data from OpenStreetMap, which almost certainly includes subway routes. I'm not sure if it would include depth, but if nothing else it would get you the lat-long coordinates for the routes.
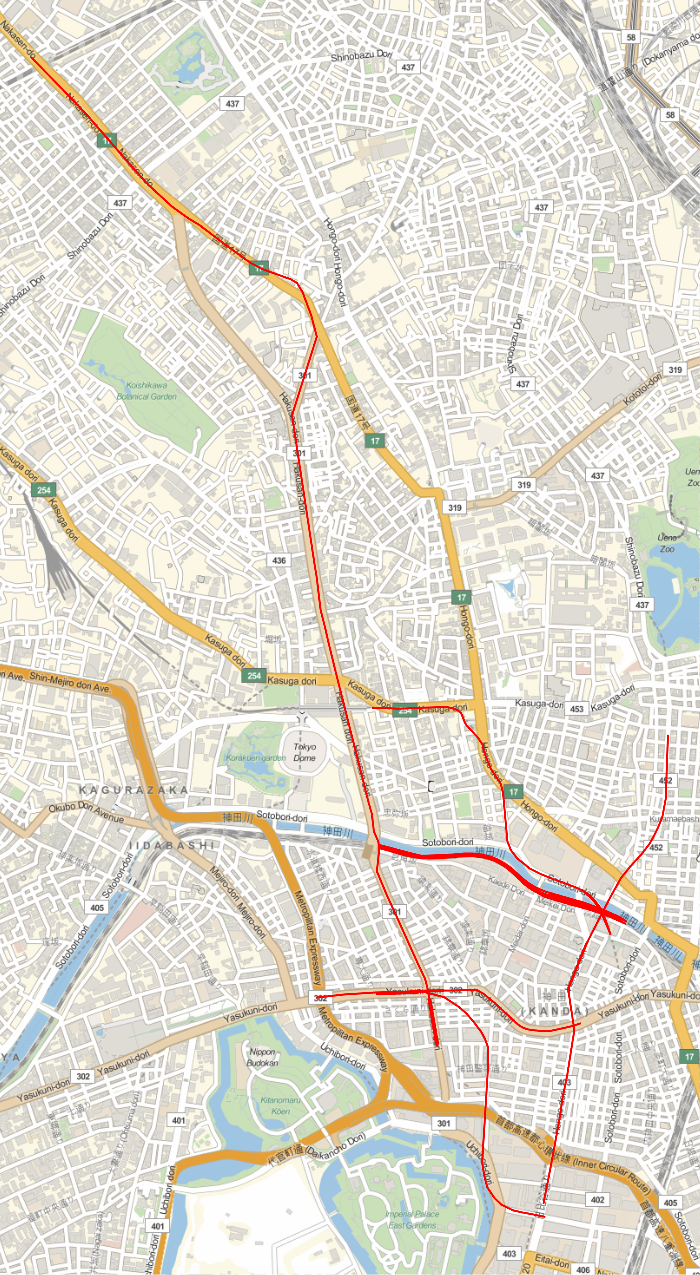
Edit:

Here is an example. First, we get the OSM data for some region in Tokyo:

osm=ResourceFunction["OSMImport"][GeoBoundsRegion[{{35.695217,35.705217},{139.756822,139.766822}}]];

This use of OSMImport uses the OSM API, which is very limited in how much it can return (I think it's no more than 50,000 objects, which is quickly used up in even a small region of well-covered cities). If you wanted to do all of Tokyo, you can use a separate API to download the XML files for the whole city and then import then using OSMImport.

First, we can look at some of the railway-related Nodes:

Select[osm["Nodes"], KeyExistsQ[#Tags, "railway"] &]

which returns things like

<|"2559434143" -> <|"Position" -> GeoPosition[{35.6996, 139.765}], 
  "Tags" -> <|"maxspeed" -> "95", "name" -> "????", 
    "name:en" -> "Ochanomizu", "name:es" -> "Ochanomizu", 
    "name:fr" -> "Ochanomizu", "name:ja" -> "????", 
    "name:ja_kana" -> "??????", "name:ja_rm" -> "Ochanomizu", 
    "name:ko" -> "?????", "name:ru" -> "??????????", 
    "operator" -> "???????", "public_transport" -> "station", 
    "railway" -> "station", "source" -> "Bing, 2007-04", 
    "train" -> "yes", "wheelchair" -> "limited", 
    "wikidata" -> "Q801289", 
    "wikipedia" -> "ja:?????"|>|>, "2559434708" -> <|"Position" -> 
   GeoPosition[{35.7002, 139.763}], 
  "Tags" -> <|"railway" -> 
     "switch"|>|>, "4855419881" -> <|"Position" -> 
   GeoPosition[{35.6959, 139.757}], 
  "Tags" -> <|"name" -> "???", "name:en" -> "Jimbocho", 
    "name:es" -> "Jimbocho", "name:ja" -> "???", 
    "name:ja_kana" -> "???????", "name:ja_rm" -> "Jimb?ch?", 
    "name:ko" -> "???", "name:ru" -> "????????", "name:zh" -> "????", 
    "network" -> "?????????", "operator" -> "?????", 
    "public_transport" -> "stop_position", "railway" -> "stop", 
    "ref" -> "Z07", "subway" -> "yes", 
    "website" -> 
     "https://www.tokyometro.jp/lang_en/station/jimbocho/", 
    "wikidata" -> "Q76805", 
    "wikipedia" -> "ja:????"|>|>, "6070813705" -> <|"Position" -> 
   GeoPosition[{35.6996, 139.765}], 
  "Tags" -> <|"loc_ref" -> "2", "name" -> "????", 
    "name:en" -> "Ochanomizu", "name:es" -> "Ochanomizu", 
    "public_transport" -> "stop_position", "railway" -> "stop", 
    "train" -> "yes"|>|>,...|>

I haven't read through the full results, but I don't think it contains depth.

However, for the lat-long data, you can use the Ways parameter to get something like this:

GeoGraphics[{Thick,Red,Line@Values@osm[["Nodes",#Nodes,"Position"]]&/@Select[osm["Ways"],KeyExistsQ[#Tags,"railway"]&]}]

trains in Tokyo

All of those routes are also internally tagged with properties like their name, gauge, max speed, operator, track voltage, passenger vs freight, etc.

Thanks a lot. I wanted to get the depth of subway stations information with Web scraping. However, I was not able to find them. Finally I've got them from the book(Japanese).

POSTED BY: Kotaro Okazaki

What a fascinating insight into the design of transportation systems in Japan, thanks for sharing! Where did you find the depth of subway stations information?

POSTED BY: Vitaliy Kaurov

enter image description here - Congratulations! This post is now a Staff Pick as distinguished by a badge on your profile! Thank you, keep it coming, and consider contributing your work to the The Notebook Archive!

POSTED BY: Moderation Team
Reply to this discussion
Community posts can be styled and formatted using the Markdown syntax.
Reply Preview
Attachments
Remove
or Discard

Group Abstract Group Abstract