Please download the notebook at the end of the discussion
The idea is from the study of the graphical representation of this inequality: for positive $a$ $b$ and $c$
$\frac{1}{a+2b}+\frac{1}{b+2c}+\frac{1}{c+2a} \le \sqrt{ \frac{a+b+c}{3abc}}$
Usually this type of problems is not AM-GM or Cauchy-Schwartz or Muirhead friendly. Very tricky to use elementary methods and they are pooly generalized to other similar case, because they highly depends on the convexity of quadratic function and critical infomation like $C^{\infty}$ is not respected.
The animation is for a generalized form of the aforementioned inequality.
WLOG (based on homogenity of power on both LHS and RHS) let's assume $a + b + c = 1$ and parameterize them with spherical coordinate:
a = (Cos[\[Theta]] Sin[\[Phi]])^2;
b = (Cos[\[Theta]] Cos[\[Phi]])^2;
c = Sin[\[Theta]]^2;
The original equation is thus reduced to this form:
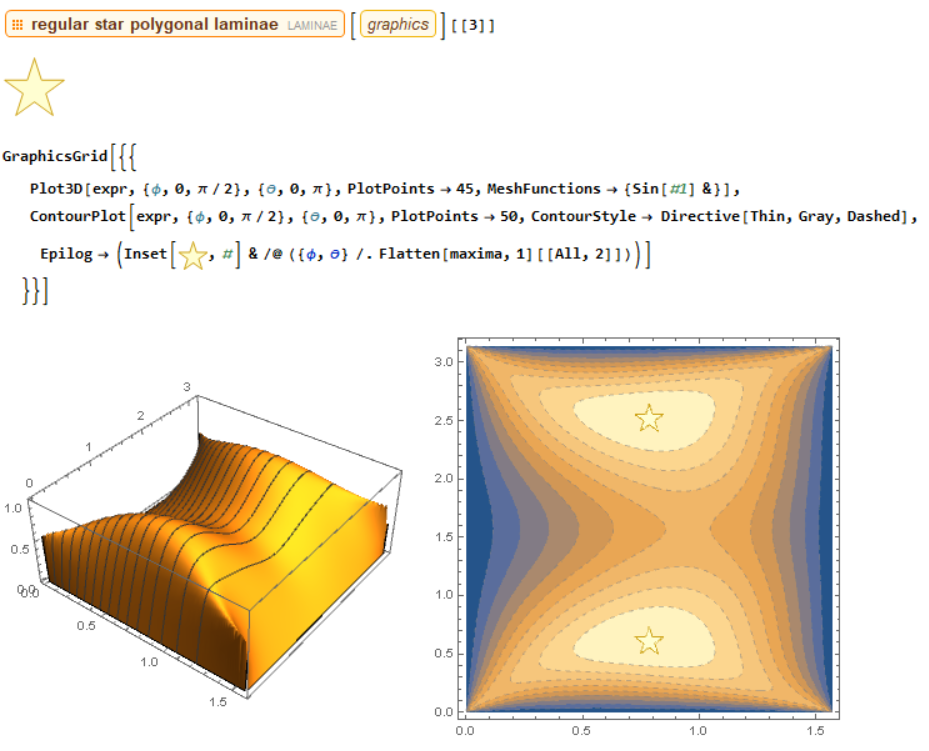
expr = Sqrt[3*a*b*c]*(1/(a + 2*b) + 1/(b + 2*c) + 1/(c + 2*a));
and the inequality problem automatically transforms to an optimization problem.
maxima = Table[
  FindMaximum[
   expr, {{\[Phi], x}, {\[Theta], y}}], {x, {1}}, {y, {0.5, 2.5}}]
Label the maxima:
I suspect the magic $3$ on the RHS of the inequality comes from the coefficients of $1(a)+2(b)$ of the denominators on the LHS (no proof and is only true for some $\lambda$) , including the cyclic forms. Thus I replace the coefficients by $1+\lambda$ and $2-\lambda$ respectively, to keep their sum equal to 3. The animation is generated by sweeping through a set of different values of $\lambda$. $Tan^{-1}$ is used to make the animation slow-mo when approaching the end points of $\lambda$ domain. The visual is smooth and soothing.
constant=N[ArcTan/@(Range[0,40,2.]*0.1)]*0.9
frames=(0.5-Reverse@constant)~Join~(0.62+constant);
ListPlot[frames]
The animation is interesting to look at. One of the unusual behavior is that the function has very flat top when $\lambda$ is close to $1.7$, the Rosenbrock function like plateau makes it very hard to find extrema.
I call it mochi because the wavy transformation of the 3D graphics in the animation resembles this video clip of baking japanese rice cake.
 Attachments:


