Hello Wolfram Community,
I want to take pictures of crops using a drone and better highlight the contrast between regions of healthy vegetation vs. areas with stressed/diseased or no vegetation (in future, extract more information about the crops).
I have recently removed an infrared blocking filter from a camera of a DJI Phantom 3 and instead mounted a filter that blocks every wavelength except Red and Near-infrared. I want red and near-infrared light because healthy vegetation will absorb red light and strongly reflect near-infrared light.
Incorporation of this filter allows reflected red light (660nm) to be captured in the camera sensors red channel and reflected near-infrared light (850nm) to be captured in the sensors blue channel (the green channel is not used). NDVI can be determined by performing the calculation: NDVI = (blue red) / (blue + red).
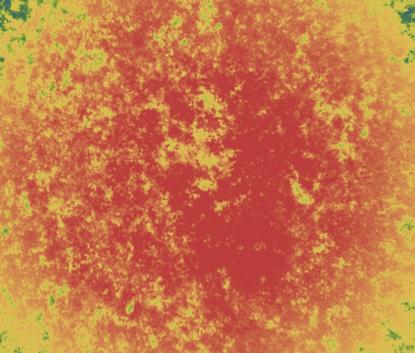
Could you please tell me how to make a heat map (maybe using DensityPlot) or any other way to better highlight the contrast instead of the Colorize function? Or if anything comes to your mind, I would be glad to hear!
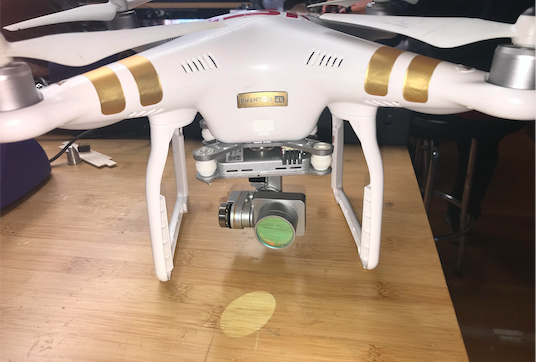
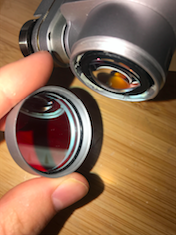
This is my first attempt in post-processing.
An approximate regular camera picture of the grass spot: 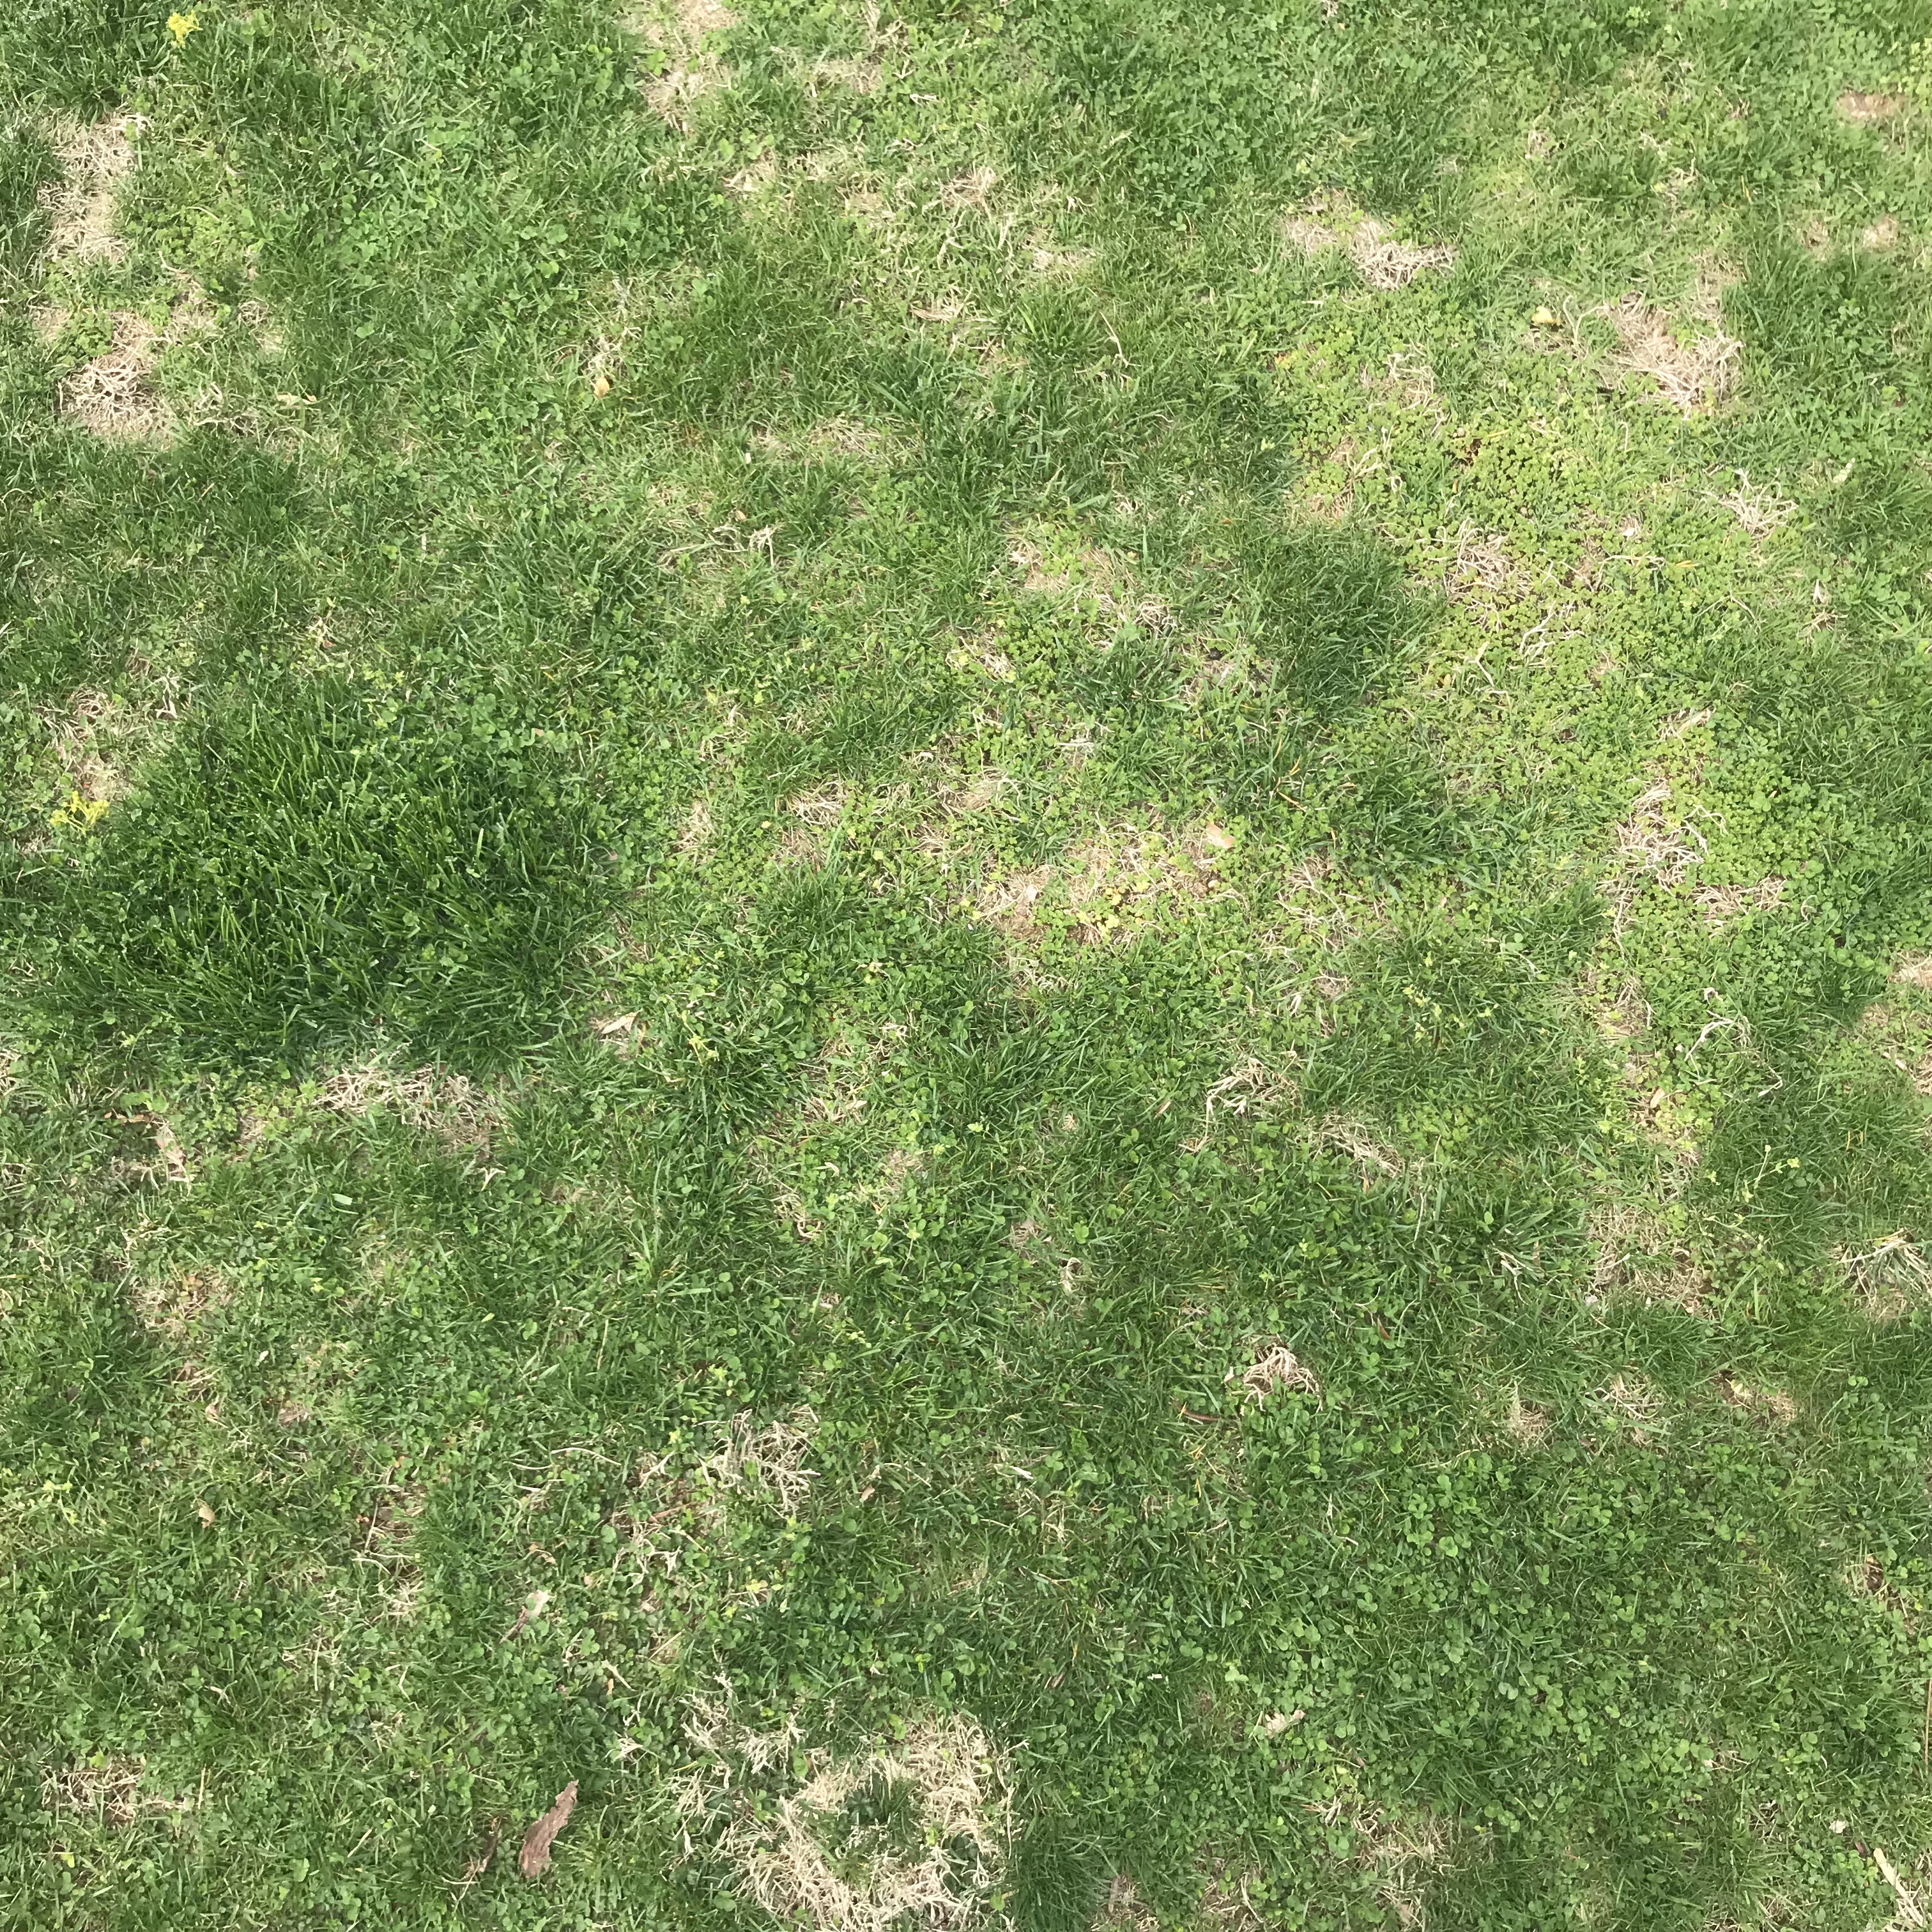
ColorSeparate[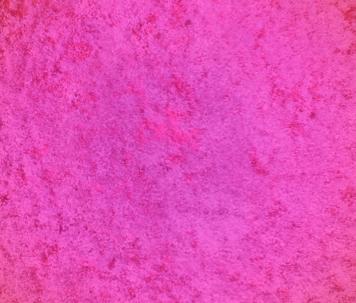 , {"R", "B"}]
Out[1] = {  ,
,  }
}
f[pixel1, pixel2] := (((pixel1 - pixel2)/(pixel1 + pixel2)) + 1)/2;
ImageApply[f, { ,
,  }]
}]
Out[3] = 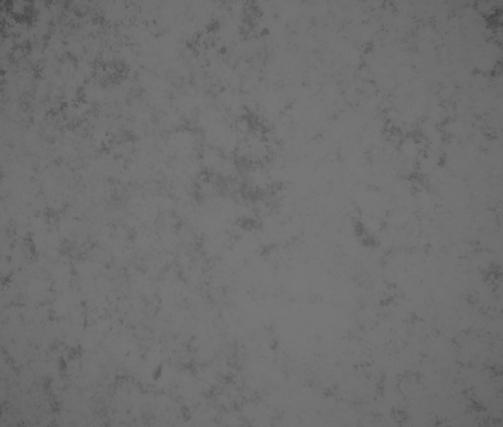
The darker spots are supposed to be less healthy vegetation.
Colorize[ ]
]
Out[4] = 