Group Abstract Group Abstract

Message Boards Message Boards

Test the significance of the result from NonlinearModelFit?

Posted 7 years ago

I have some data, and I have done a NonlinearModelFit on it, actually fitting it to a sine curve. I can get the "RSquared" and "AdjustedRSquared", e.g. with nlm["AdjustedRSquared"] where nlm is the output of the NonlinearModelFit. I now want to test the significance of the result. I would like to end up with a single number p, so that I could say, "the probability of getting such a fit by chance is p".

NonlinearModelFit has properties like "ParameterPValues" and "ParameterTStatistics". However, I have looked in the StatisticalModelAnalysis tutorial, and there is no real explanation of how they might be used or generally how to do significance testing.

Does NonlinearModelFit have built in ways to get significance (probability of fit being due to chance)? Or is there a good tutorial on using the output of Mathematica's NonlinearModelFit to do significance testing?

POSTED BY: Marc Widdowson
5 Replies
Posted 6 years ago

Hope it was helpful.

There is a different interpretation between the $R^2$ calculated using LinearModelFit and NonlinearModel but not because of something intrinsically different between linear and nonlinear models but rather that Mathematica chooses to use two different formulas for $R^2$ for the two procedures.

LinearModelFit uses $1-{{SS_{res}}\over{SS_{corrected Total}}}$ and NonlinearModelFit uses $1-{{SS_{res}}\over{SS_{uncorrected Total}}}$. One can see this by fitting the same linear model in LinearModelFit and NonlinearModelFit.

POSTED BY: Jim Baldwin
Posted 7 years ago
POSTED BY: Jim Baldwin
Posted 6 years ago

Thank you very much. This is very helpful. The data I am working with is the percentage of "anocracies" (between democracy and autocracy) in the Polity IV database of regime types from 1800 to 2017, which you would not expect to be sinusoidal. It looks like it would probably fit a saw tooth wave as well as or better than a sine wave. However, a sine wave is the solution to a simple dynamic model (second derivative proportional to negative of current value), and so its presence provides a good starting point for developing a theory of what is going on.

The issue about R2 having a different interpretation is in the Mathematica Tutorial on Statistical Model Analysis. It says, "The coefficient of determination does not have the same interpretation as the percentage of explained variation in nonlinear models as it does in linear models because the sum of squares for the model and for the residuals do not necessarily sum to the total sum of squares." I'm not sure why this is, but I suppose it's to do with the non-linearity. It would be nice if they said how we might interpret it, but they don't...perhaps because it depends entirely on the situation.

POSTED BY: Marc Widdowson
Posted 7 years ago

Thank you very much. My understanding of probability and statistics is rather rusty. I could really do with a worked example of hypothesis testing for a NonlinearModelFit, to get a feel for what is possible and how it is done.

In my particular case, I have data that I have fitted to a sine curve. The image below, captured from my notebook, shows the data (the dots) with the fitted model (the line). I get an AdjustedRSquared of 0.988181. I would like to know what to make of this.

Sine wave fitted to data

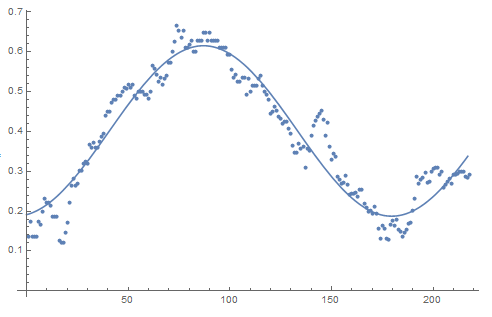
I read that AdjustedRSquared doesn't have the same meaning with a nonlinear as with a linear fit (it's not the percentage of the variation that is explained). Visually, the data seem to fit a sine wave pretty well. But what can I tell people better than just it looks nice? How convinced should we be by this? What basis is there for saying that these data were generated by a sine-like process (plus it looks like some lower amplitude process with irregular oscillations, plus some noise)?

If the null hypothesis were that the data are distributed randomly across the page, I'd imagine that the sine wave comes out as pretty significant. How would I calculate this from NonlinearModelFit's properties? And is that a fair way of doing it? There are 217 data points and 4 parameters (it is fitted to a + b Cos[k x + p]) so lots of degrees of freedom but, on the other hand, it is only just over one cycle of the sine wave. I'd be happy to say that it is a sine wave with a slowly varying period so we don't notice the change over one cycle...

POSTED BY: Marc Widdowson
Posted 7 years ago

What question do you want associated with a test of significance? Is it about specific parameters? Linear combinations of parameters? Predictions? NonlinearModelFit can certainly perform the appropriate test or provide information to be able to construct an appropriate test. One just needs to be specific about what you want to test and under what conditions.

Tests of significance aren't necessarily very useful unless you have some idea as to what kind of difference from a hypothesized value you're looking for. Maybe estimation rather than hypothesis testing is what might be more appropriate for your needs.

Also, "the probability of getting such a fit by chance is p" is not quite right about resulting P-values. A P-value is the probability of observing a test statistic at least as extreme as what you observed when a specified null hypothesis about the value of some unknown quantity is true.

POSTED BY: Jim Baldwin
Reply to this discussion
Community posts can be styled and formatted using the Markdown syntax.
Reply Preview
Attachments
Remove
or Discard