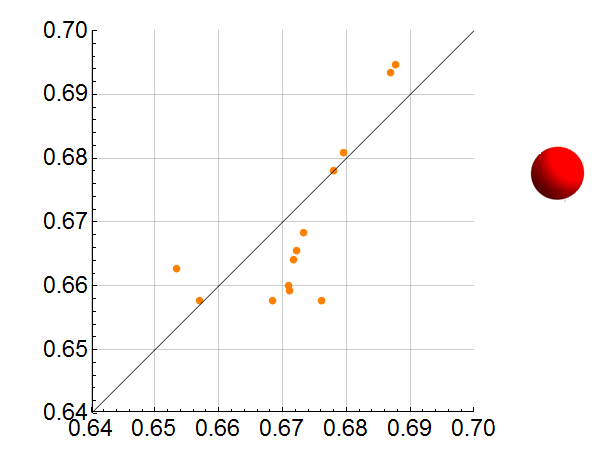
Hi How do I replace all normal point with bubble point like the below plot:
m = {{0.676168282`, 0.65776549947501`}, {0.671137774`,
    0.659222459526278`}, {0.671010714`,
    0.659990068731665`}, {0.671762604`,
    0.664138272302896`}, {0.67218621`,
    0.66552936163932`}, {0.673216749`,
    0.668311540479097`}, {0.67799459`,
    0.678049166167921`}, {0.679546306`,
    0.680831345007698`}, {0.686881695`,
    0.693351149536299`}, {0.687708356`,
    0.694742238872723`}, {0.668473616`,
    0.65776549947501`}, {0.656997668`,
    0.65776549947501`}, {0.653419063`, 0.662747182883008`}};

ListPlot[m, Mesh -> All, ImageSize -> 500, AspectRatio -> Automatic,
 TicksStyle -> Directive[Black, 15],
 AxesStyle -> Directive[Black, 12], Ticks -> Automatic,
 GridLines -> Automatic, Axes -> True,
 PlotRange -> {{0.64, 0.70}, {0.64, 0.70}},
 PlotStyle -> {PointSize[.02], Orange},
 Epilog -> Line[{{0, 0}, {1, 1}}]]
