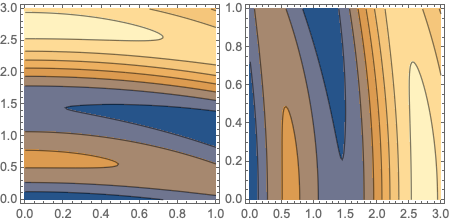
Since no working example was provided, it is not clear what you are trying to plot. ContourPlot requires a function of two variables. If you want to swap the x and y coordinates, swap the range specifications for x and y. e.g.
Row[{
  ContourPlot[y + Sin[x^2 + 3 y], {x, 0, 1}, {y, 0, 3},
   ImageSize -> Small],
  ContourPlot[y + Sin[x^2 + 3 y], {y, 0, 3}, {x, 0, 1},
   ImageSize -> Small]
  }]
