Message Boards Message Boards

0
|
6889 Views
|
2 Replies
|
1 Total Likes
View groups...
Share
Share this post:

How to Reverse the axes in contourplot?

Posted 5 years ago

I have a long relation between "Betta[omega]" versus "omega". When I use <<Contourplot>>, at first I should define the range of omega, and the range of Betta[omega] should be defined at the end. As a result the plot is "omega versus Betta". I mean the horizontal axis is omega. But I want to plot Betta as a horizontal axis. What should I do? Any help would be appreciated.

POSTED BY: Skill 93
2 Replies
Posted 5 years ago

Since no working example was provided, it is not clear what you are trying to plot. ContourPlot requires a function of two variables. If you want to swap the x and y coordinates, swap the range specifications for x and y. e.g.

Row[{
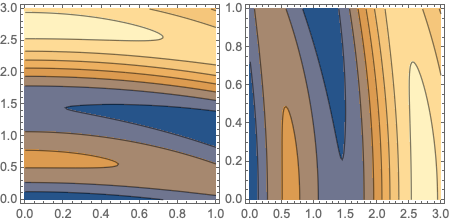
  ContourPlot[y + Sin[x^2 + 3 y], {x, 0, 1}, {y, 0, 3}, 
   ImageSize -> Small],
  ContourPlot[y + Sin[x^2 + 3 y], {y, 0, 3}, {x, 0, 1}, 
   ImageSize -> Small]
  }]

enter image description here

POSTED BY: Rohit Namjoshi
Posted 5 years ago

Thanks, I did, but it did not work. and it shows nothing . because Y is a function of x. could you please look at the attachment. Regards.

Attachments:
POSTED BY: Skill 93
Reply to this discussion
Community posts can be styled and formatted using the Markdown syntax.
Reply Preview
Attachments
Remove
or Discard

Group Abstract Group Abstract