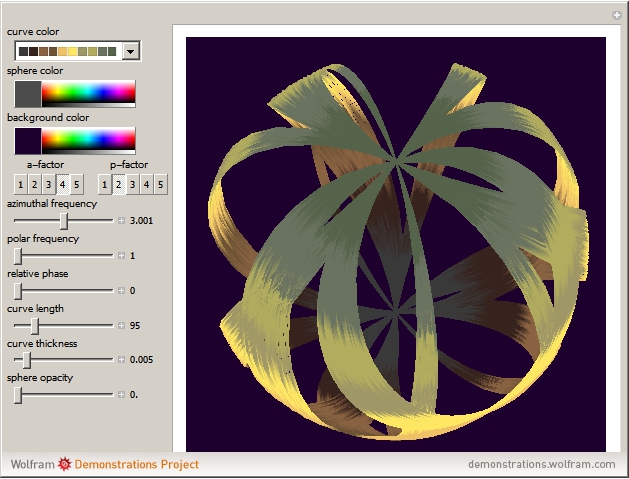
As a starting point take a look at this Demonstration:
Lissajous Patterns on a Sphere SurfaceThe source code is free and you can download it from that link. But it is also rather short so I give it below.
Manipulate[
Module[{\[Theta] =
azf \[Pi]/2 Cos[a t + \[Phi]], \[CurlyPhi] = \[Pi] -
pof \[Pi] Cos[b t]},
Show[ParametricPlot3D[{Cos[\[CurlyPhi]] Cos[\[Theta]],
Cos[\[Theta]] Sin[\[CurlyPhi]], Sin[\[Theta]]}, {t, 0, tmax},
PlotStyle -> Thickness[thick], ColorFunction -> cofu,
PerformanceGoal -> "Quality", PlotPoints -> Round[3/7 tmax + 100]],
Graphics3D[{sphco, Opacity[op], Specularity[.5, 20],
Sphere[{0, 0, 0}, 1]}], SphericalRegion -> True,
Background -> bgrco, Boxed -> False, Axes -> False,
ViewAngle -> .31, ImageSize -> {420, 420}, PlotRange -> 1,
ViewPoint -> {1.1671864955891427`, -0.6038252372177897`,
3.1181838892876774`}, BoxRatios -> {1, 1, 1}]],
"curve color",
{{cofu, 52, ""},
Dynamic[# ->
Show[ColorData[#, "Image"], ImageSize -> 100] & /@ (ColorData[
"Indexed"]~Join~ColorData["Gradients"])],
ControlType -> PopupMenu},
"sphere color",
{{sphco, RGBColor[0., 0.9678, 1.], ""}, GrayLevel[.3],
ImageSize -> Small},
"background color",
{{bgrco, RGBColor[0.2727, 0., 0.08798], ""}, GrayLevel[.3],
ImageSize -> Small},
Grid[Transpose[{{"a-factor",
Control[{{azf, 1, ""}, Range[5]}]},
{"p-factor",
Control[{{pof, 1, ""}, Range[5]}]}}]],
"azimuthal frequency",
{{a, 4.01, ""}, 1, 5, Appearance -> "Labeled", ImageSize -> Small},
"polar frequency",
{{b, 3.61, ""}, 1, 5, Appearance -> "Labeled", ImageSize -> Small},
"relative phase",
{{\[Phi], 0, ""}, 0, 2 Pi, Appearance -> "Labeled",
ImageSize -> Small},
"curve length",
{{tmax, 100, ""}, 0.1, 500, Appearance -> "Labeled",
ImageSize -> Small},
"curve thickness",
{{thick, .005, ""}, 0, .05, Appearance -> "Labeled",
ImageSize -> Small},
"sphere opacity",
{{op, 0.31, ""}, 0, 1, Appearance -> "Labeled", ImageSize -> Small},
ControlPlacement -> Left]


