Introduction
Mathematical literacy has become a familiar term in higher education and computational thinking as a way of communicating has also propelled its way into the main stream of our society. As a professional in the area of higher education, I am obligated to make a pathway for our students in all areas of studies to immerse themselves into this technological shift.
This project aims at combining the usages of smart phones and Wolfram Language in the delivery of one of our core courses. The core course considered here is required for all freshmen students. Approximately 30 sections of the course is offered in each semester and each section has about 30 students coming from all disciplines ranging from engineering, sciences, math, to arts, and architecture.
Currently, we are already using smart phones as a tool, in some cases the only tool, in hands-on activities or experiments. This project integrates Wolfram Language with the application of smart phones so to encourage students to make comparisons between theory and observation. Since all students are required to use smart phone for his/her all course works, the Wolfram Cloud App will be heavily used for activities and interactions. By doing so, Wolfram Language becomes much more personal and powerful.
Many on-line resources, such as the Wolfram University, have become available for students to have a jump start in using the Wolfram Language. This is particularly helpful in initial training so we will use it as a teaching tool.
Integration of smart phones and Mathematica
In the following, we will discuss a few examples of engaging practices that each student will work on his/her own. All of these examples can be chosen by courses at different levels or disciplines.
Example 1 Voice recognition and analysis
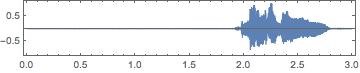
This example uses AudioCapture to help students capture his/her own voice then analyze it at a basic level. The analysis and especially the visualization of student's own voice would serve as an effective draw of their interests to Mathematica.
The picture shows the spectrogram of a voice recorded by a student. 
More interestingly, the student can use AudioLocalMeasurement and compare his/her voice data with the built-in data based of formants so to make the study more personal.
Example 2 Capture an audio data of a student by smart phone
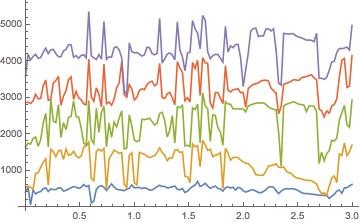
The following example links students' smart phones to Wolfram Language. Specifically, an audio signal was captured by an iPhone using the SpectrumView App and then downloaded to a local computer for visualization. The beauty of this example is that every student can have a wide degree of freedom in choosing their sound object based on his/her own interest. In addition, there will be almost no limitation in when or where a sound signal can be captured. For instance, a student interested in a musical instrument, he/she can then use the App to get the data at any time and anywhere. A student could also bring the smart phone to a concert hall, as an example to capture the signal then analysis it to understand the acoustics of the concert hall space.
Above pictures show the time series of the intensity and the spectrum of the captured voice.
Example 3. Analysis of audio signals from an air tube
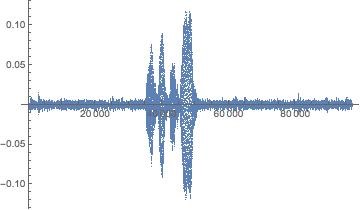
For individuals who are more advanced in physics, this example gives an excellent demonstration of studies of resonance frequencies of a system. The audio signals from a Wolfram water bottle, which everyone at this summer school has, are captured using the SpectrumView App, then analyzed using Wolfram Language.
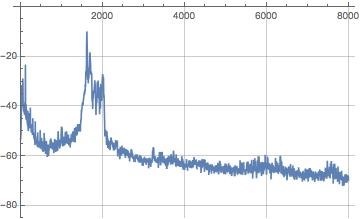
At this summer school, each participant received a Wolfram water bottle and it has been used as the air tube for our study. The tube is about 0.3 (m) long and is half open. Any entry-level physics textbook would have an example of the tube and show that the wavelength of the lowest standing wave (or resonant mode) is 4 x length, which is 1.2 (m). The corresponding frequency is the speed of sound/wavelength. As such, the lowest peak one would expect to see is at 283 (Hz). The second lowest mode is at 3 x 283, or 850 (Hz). The student would tap the tube to get the modes inside the bottle excited. Then the subsequent time series is recorded and analyzed using Wolfram Language. The following is a spectrum of the time series.
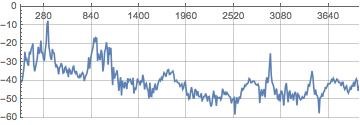
The first peak is almost exactly at 283 (Hz), and the second peak is also very close to the theoretical result.


