Message Boards Message Boards

0
|
1630 Views
|
1 Reply
|
0 Total Likes
View groups...
Share
Share this post:
GROUPS:

Curve fitting in Mathematica

Posted 11 years ago
Hi there,
 I have got a question which I haven't found to be covered elsewhere. I have a xy-data table with geophysical measurements (red curve).
If I plot it, it looks like this:

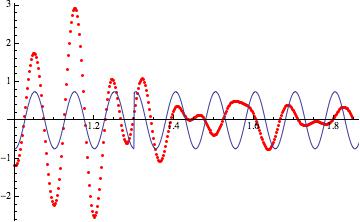
I'm now searching the function behind it (the one above is not good enough because I need the change in the amplitude). I tried various functions but none seems to work. Sofar, this is the best:

data = APIdat;
fit =
NonlinearModelFit[data,
  y0 + A 2.5 Sin[Pi (x - xc)/w + If[x < 1.3, 0.2, 3.1]], {y0, xc, A,
   w}, x, Method -> {NMinimize,
    Method -> {"DifferentialEvolution", "ScalingFactor" -> 0.9,
      "CrossProbability" -> 0.005,
      "PostProcess" -> {FindMinimum, Method -> "QuasiNewton"}}}]

Thanks a lot for your help - any help  is welcome.

Ciao
POSTED BY: sascha flögel
NonlinearModelFit isn't probably the right tool for this job. We could make the model complex enough for it to describe pretty much every curve, but that isn't the purpose of the tool.
But knowing how to help probably requires a bit more information, such as what kind of description of the curve is acceptable for your purposes.

Have you considered maybe taking a discrete fourier transform of the data, truncating it, and then using that? Maybe something similar will be useful?
POSTED BY: Sean Clarke
Reply to this discussion
Community posts can be styled and formatted using the Markdown syntax.
Reply Preview
Attachments
Remove
or Discard

Group Abstract Group Abstract