Hi there,
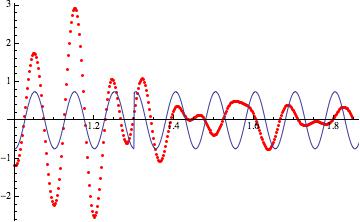
I have got a question which I haven't found to be covered elsewhere. I have a xy-data table with geophysical measurements (red curve).
If I plot it, it looks like this:

I'm now searching the function behind it (the one above is not good enough because I need the change in the amplitude). I tried various functions but none seems to work. Sofar, this is the best:
data = APIdat;
fit =
NonlinearModelFit[data,
y0 + A 2.5 Sin[Pi (x - xc)/w + If[x < 1.3, 0.2, 3.1]], {y0, xc, A,
w}, x, Method -> {NMinimize,
Method -> {"DifferentialEvolution", "ScalingFactor" -> 0.9,
"CrossProbability" -> 0.005,
"PostProcess" -> {FindMinimum, Method -> "QuasiNewton"}}}]
Thanks a lot for your help - any help is welcome.
Ciao