Introduction:
Emojis over time have become an important form of expressing emotions, especially in the social media world. Understanding how people use emojis and how the usage varies across countries can help us understand human behaviour better. The main aim of this project was to explore which emojis are dominantly popular in a specific geographic area.
Further, a short exploration was made into how different socio-economic factors may affect emoji usage.
Methodology:
All the data was obtained in the form of geolocation tagged tweets from Twitter. Further, the emojis were isolated from each tweet (also based on country), and their usage was analysed.
Initial Attempts
Initially I started off by developing a pseudo dataset, forming a list of countries and their respective emoji usage frequency, randomly generated. This was done as an attempt to better understand possible approaches to solving the problem.
In the beginning, the goal of the study was to explore the emoji usage patterns for a few countries, say the top 10 twitter using countries. However, being able to extract emojis from tweets is a more powerful tool than I originally anticipated. So, I decided to do it for all the countries that the Wolfram Language has in its repository.
Extracting Data from Twitter
I used ServiceConnect, a built in function of the Wolfram Language, to connect to Twitter, and then used the TweetSearch attribute to extract Twitter data from 226 countries. Unfortunately, around 22 countries data was not available, and so are excluded from the current study.
twitter=ServiceConnect[Twitter]
twitter["TweetSearch", "Query" -> "", GeoLocation -> #,
MaxItems -> 2000 ]
countries = CountryData[];
Block[{results, filename},
results =
twitter["TweetSearch", "Query" -> "", GeoLocation -> #,
MaxItems -> 2000 ];
filename =
FileNameJoin[{"/Users/anweshadas/Desktop/Wolfram emoji \
project/Extracting the Emoji/", "Results_" <> #["Name"] <> ".m"}];
Export[filename, results];
Pause[120]; ]
All the data that was collected was stored on a local folder on the computer.
Extracting Emoji from Tweets
Extracting emojis from a tweet was by far the most difficult part of the problem. The problem being that all the tweets on Twitter are encoded in UTF-16, whereas the Wolfram Language FromCharacterCode function uses UTF-8.
As a first step, I imported the unicodes for all the emojis into the Mathematica notebook.
string = Import[

   "http://unicode.org/Public/emoji/12.0/emoji-data.txt"];


goodLines =

  Select[StringTrim /@ StringSplit[string, "\n"] /. "" -> Nothing,

   StringTake[#, 1] =!= "#" &];


codes = First /@ (StringSplit[#] & /@ goodLines);


allCodesUNICOD =

  Union@Select[

    With[{d = FromDigits[#, 16] & /@ Flatten[StringSplit[#, "."] /. "" -> Nothing]},

        If[Length[d] == 1, d, Range @@ d[[{1, -1}]]]] & /@ codes //

     Flatten, # >= 9728 &];
Next, I imported the twitter data (which was stored on the computer in the previous step) into the notebook.
filenames = FileNames["*.m", NotebookDirectory[]];


missing = {"Canada", "Chad", "Democratic Republic of the Congo",

   "Egypt", "Falkland Islands", "Libya", "Mauritania", "Mongolia",

   "Myanmar", "Nicaragua", "Niger", "Norfolk Island", "Romania",

   "Somalia", "Svalbard", "Sweden", "Syria", "Tonga", "Turkmenistan",

   "Tuvalu", "Uzbekistan", "Zambia"};


missingEntity = Interpreter["Country"][#] & /@ missing;

cData = Complement[ StringCases[filenames, ___ ~~ "/Results_" ~~ x__ ~~ ".m" :> x] //

    Flatten, missing];


newfilenames = filenames //  Select[MemberQ[cData, StringCases[#, ___ ~~ "/Results_" ~~ x__ ~~ ".m" :> x] //

       First] &];


alldata = Import[#] & /@ newfilenames;
Next, I created a list of all the countries for which the data was collected.
countries = CountryData[];


newcountries = Select[countries, ! MemberQ[missingEntity, #] &];
Then I extracted the text part from the tweets, and converted them into unicode.
alltext = alldata[[#]][All, "Text"] & /@ Range[alldata // Length];


allcodes = ToCharacterCode[alltext[[#]] // Normal, "Unicode"] & /@

   Range[alltext // Length];
Then threaded them as an association.
allthread = AssociationThread[newcountries -> allcodes];
The final step to extracting the emojis was converting all of the UTF-16 codes into UTF-8, which allowed the Wolfram Language to interpret them.
toCodePoint[{a_, b_}] /; 16^^d800 <= a <= 16^^dbff && 16^^dc00 <= b <= 16^^dfff :=

 (a - 16^^d800)*2^10 + (b - 16^^dc00) + 16^4.


datacleaned = Map[toCodePoint[#] /. _toCodePoint -> First@# & /@ Partition[#, 2, 1] &, allthread, {2}] /. r_Real :> Floor@r;
The output of this step was a list of all the emojis used in all the Tweets for each country.
justEmojis = Cases[#, Alternatives @@ allCodesUNICOD, {2}] & /@ datacleaned;
Exploration: GDP and Literacy Fraction
I feel that emojis are a very powerful outlet towards understanding human behavior. Hence, I wondered if socio economic conditions of a country might influence their emoji usage. In this project, I took the case of two very common social indicators- GDP (Gross Domestic Product) and Literacy Fraction.
Results
The next step was to get a list of number of emojis present in tweets per country.
sortedCountries = Length /@ justEmojis // Normal;
In order to have a better understanding of the data, I decided to calculate the emoji usage density (number of emojis per tweet) for each country.
a = sortedCountries // Values;


theactualnumberoftweets =

  AssociationThread[newcountries -> Length /@ alldata] // Normal;


b = theactualnumberoftweets // Values;


theemojiratio =

  Table[N[Part[a, n]/Part[b, n]], {n, Length@newcountries}];
I was also curious to find out that on an average what percentage of tweets contain an emoji. Results suggest that on an average, 63% of tweets use emojis. Next, I plotted a weighted map for emoji usage density.
GeoRegionValuePlot[AssociationThread[newcountries -> theemojiratio],

 ImageSize -> 500]

Density Plots by Continent
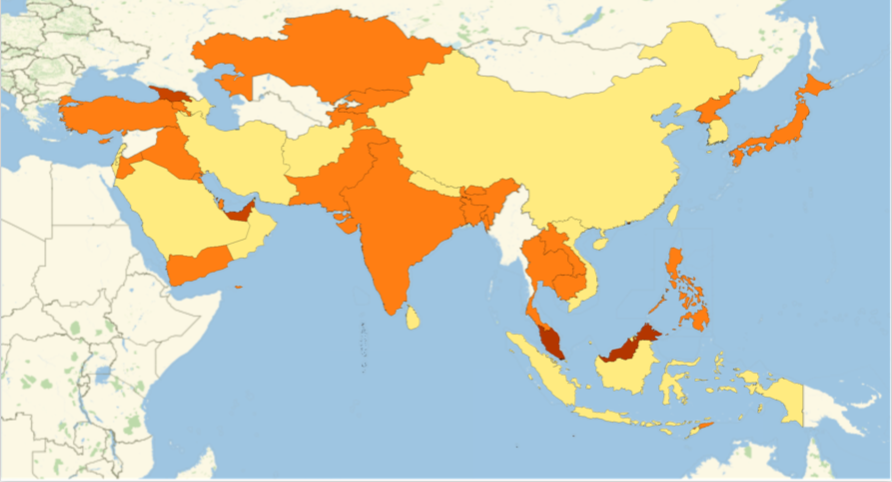
After this, I decided to have an emoji density map for each continent, in order to understand emoji usage frequency in specific regions.
Asia
AsiaGeoRegion = Part[amapfortheemojiratio, #] & /@ Position[newcountries, #] & /@

    Entity["GeographicRegion", "Asia"][EntityProperty["GeographicRegion", "Countries"]] // Flatten;


GeoRegionValuePlot[AsiaGeoRegion, ImageSize -> 500]
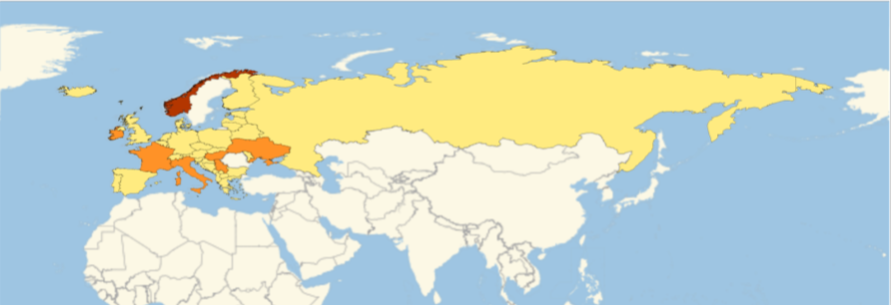
Europe
EuropeGeoRegion = Part[amapfortheemojiratio, #] & /@ Position[newcountries, #] & /@ Entity["GeographicRegion", "Europe"][ EntityProperty["GeographicRegion", "Countries"]] // Flatten;


GeoRegionValuePlot[EuropeGeoRegion, ImageSize -> 500]
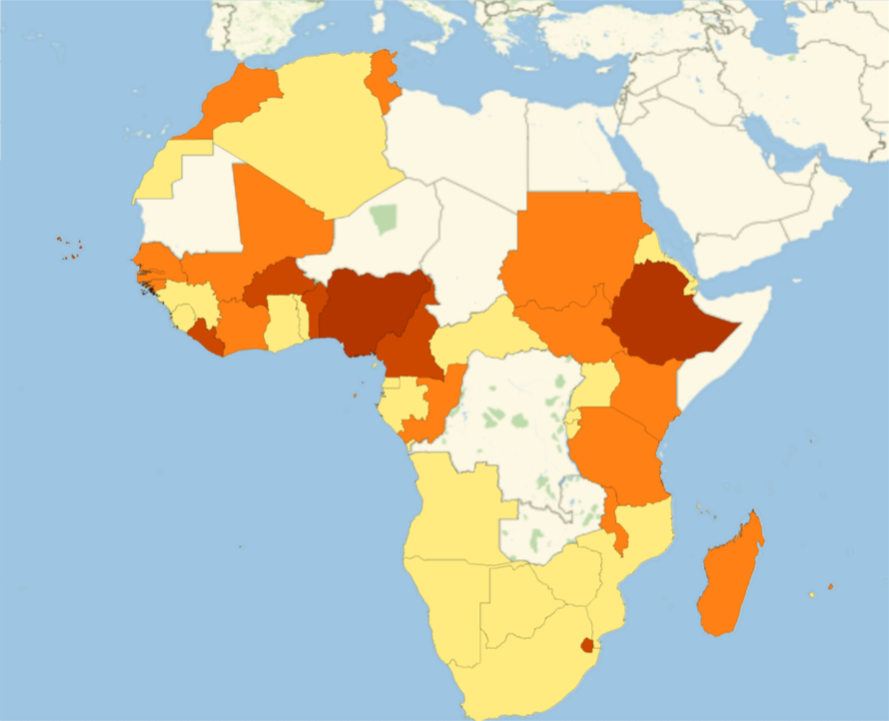
Africa
AfricaGeoRegion = Part[amapfortheemojiratio, #] & /@ Position[newcountries, #] & /@

    Entity["GeographicRegion", "Africa"][EntityProperty["GeographicRegion", "Countries"]] // Flatten;


GeoRegionValuePlot[AfricaGeoRegion, ImageSize -> 500]
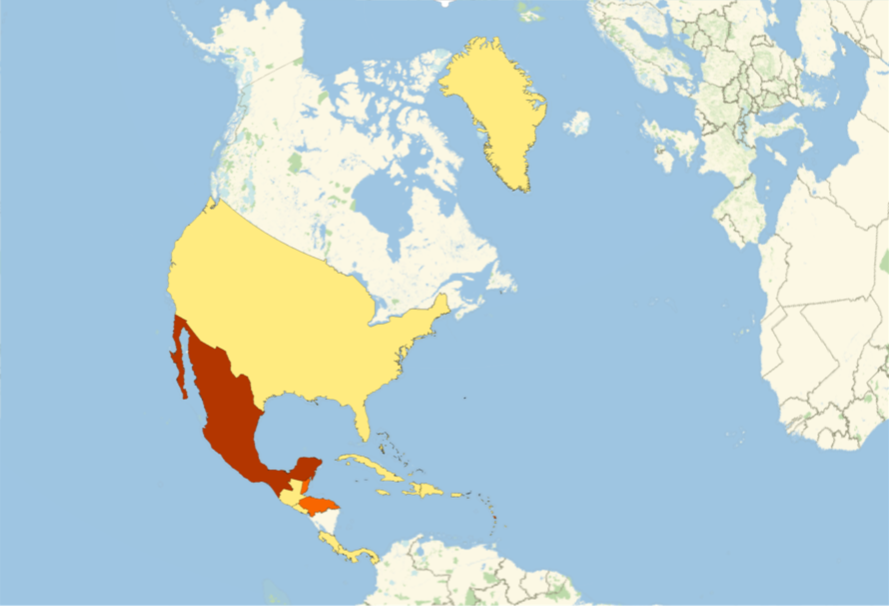
North America
NorthAmericaGeoRegion = Part[amapfortheemojiratio, #] & /@ Position[newcountries, #] & /@

    Entity["GeographicRegion", "NorthAmerica"][EntityProperty["GeographicRegion", "Countries"]] // Flatten;


GeoRegionValuePlot[NorthAmericaGeoRegion, ImageSize -> 500]
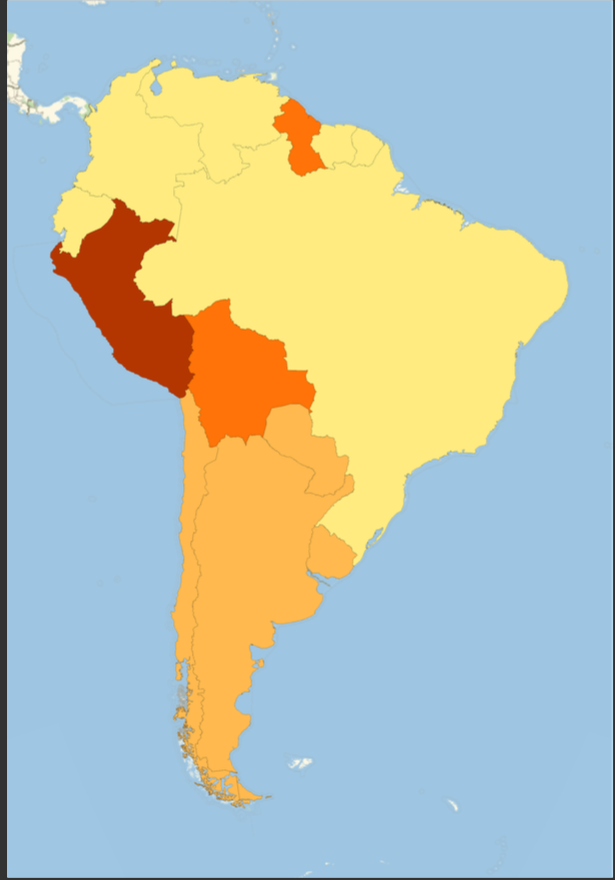
South America
SouthAmericaGeoRegion =

 Part[amapfortheemojiratio, #] & /@ Position[newcountries, #] & /@

 Entity["GeographicRegion", "South America"][EntityProperty["GeographicRegion", "Countries"]] // Flatten;


GeoRegionValuePlot[SouthAmericaGeoRegion, ImageSize -> 500]
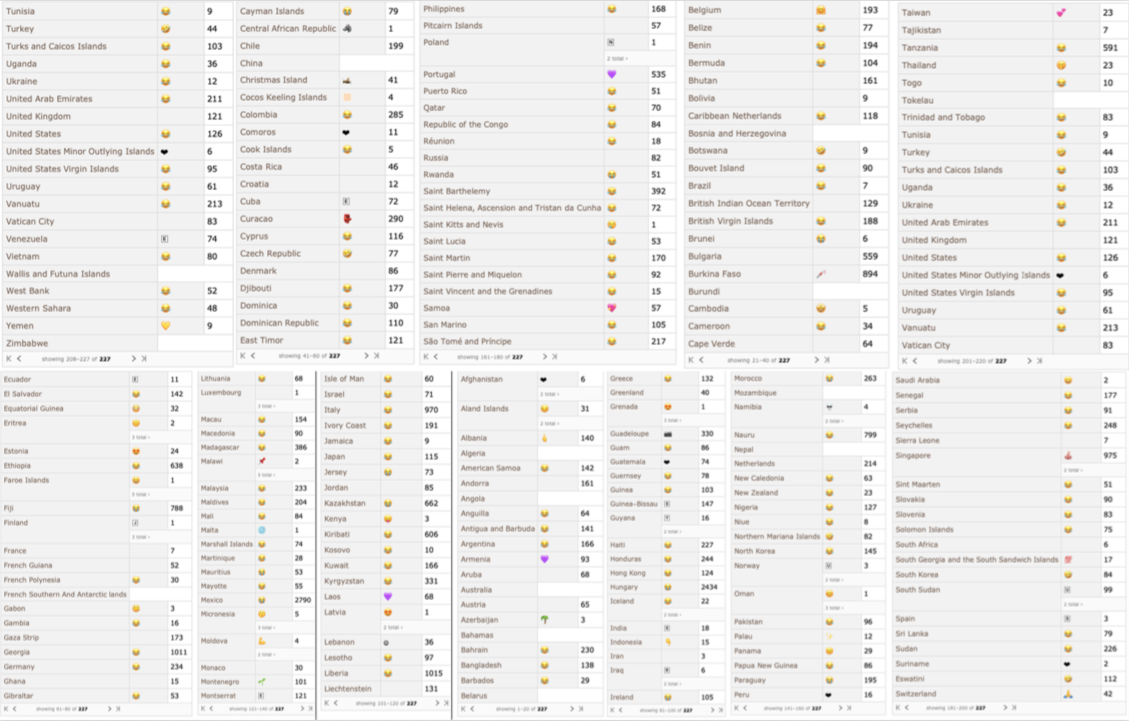
Most Common Emojis by Country
One of the most important parts of the project was to investigate the most common emoji for each country.
cuteEmojis = KeyMap[FromCharacterCode, #] & /@  ReverseSort /@ Counts /@ justEmojis;

ds = Dataset@cuteEmojis;


ds[1 ;;, Association@MaximalBy[Normal@#, Last] &]
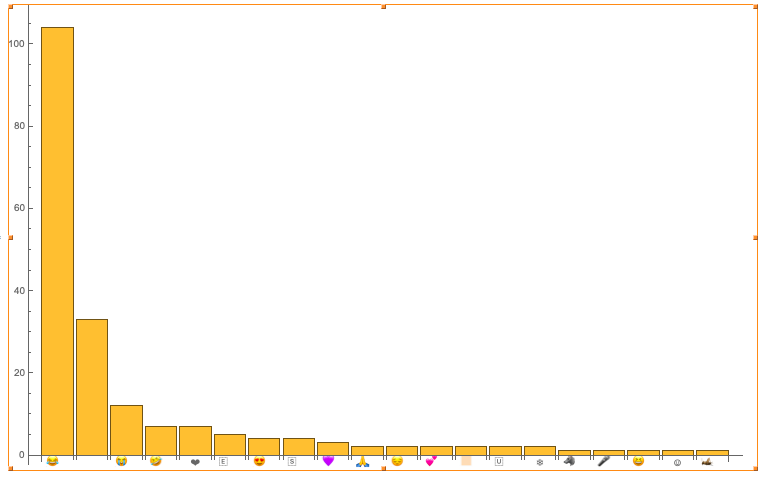
Most Common Emoji Globally
To illustrate the global frequency of specific emoji usage, I plotted a bar chart for the 20 most common emojis.
BarChart[Last /@ Take[Reverse[SortBy[MostCommonEmojis, Last]], 20],

 ChartLabels -> First /@ Take[Reverse[SortBy[MostCommonEmojis, Last]], 20] ,

 ImageSize -> 750]
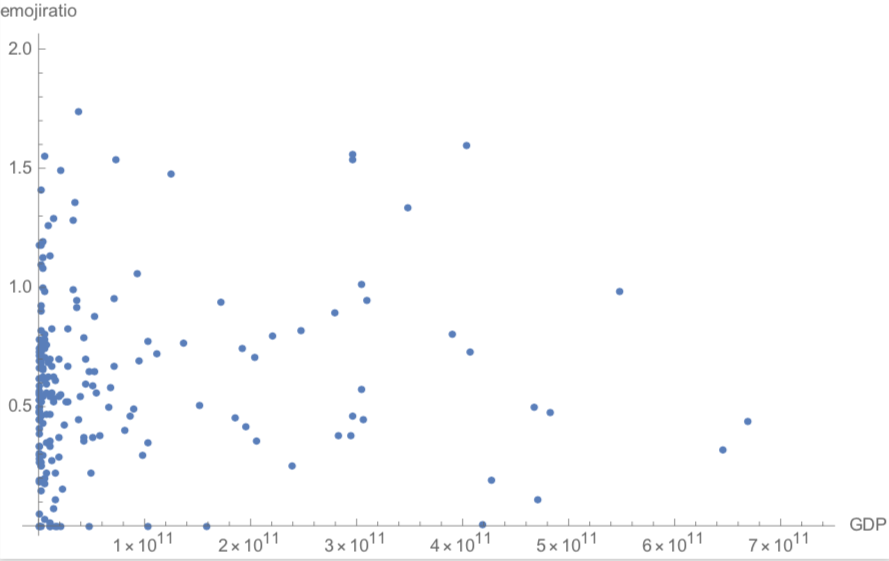
GDP and Literacy Fraction
As mentioned in the methods section, as an exploratory question for the project was to try and see if I could find any correlation between the GDP and emoji usage and between literacy ratio and emoji usage.
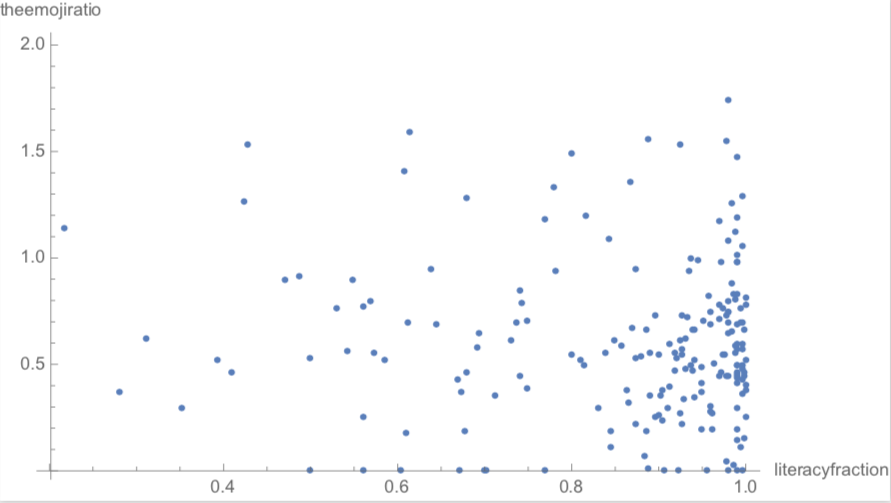
Unfortunately, no clear trend was observed for the GDP vs emoji usage plot. However, for the literacy fraction vs emoji usage, a positive trend was observed, i.e. emoji usage goes up as the literacy fraction goes up.
GDP vs EmojiRatio
gdp = CountryData[#, "GDP"] & /@ newcountries;


listplotdata = SortBy[Select[Thread[gdp -> theemojiratio], ! MissingQ[#[[1]]] &] //

     Normal, Keys];


gdpdataplotted = ListPlot[List @@@ listplotdata, AxesLabel -> {"GDP", "emojiratio"},

  ImageSize -> 500]
Literacy Fraction vs EmojiRatio
literacyfraction = CountryData[#, "LiteracyFraction"] & /@ newcountries;


literaryfractionsorted = SortBy[Select[Thread[literacyfraction -> theemojiratio], !

       MissingQ[#[[2]]] &] // Normal, Keys];


literacyfractionplot = ListPlot[List @@@ literaryfractionsorted,

  AxesLabel -> {"literacyfraction", "theemojiratio"}, ImageSize -> 500]
Conclusion:
In this project, around 220 000 tweets from 226 countries was used. The tears of joy emoji was found to be the most popular globally, in addition to being the most used for 104 countries. This was followed by the crying loudly' emoji !
Future Work
This work can of course be improved with more consistent data. In addition to this, one interesting extension of the project could be to explore how the first/official language of a country affects its emoji usage patterns. A possible approach is to try and find a correlation between alphabet length (for eg. 26 for English) and emoji usage density.
Acknowledgement:
A big shout out to my mentor who made this project possibleRory Foulger. Also, a big Thank You to mentors Kyle Keane, Philip Maymin, Christian Pasquel and Mads Bahramiwho too were an integral part of this project.
References:


