Message Boards Message Boards

0
|
12215 Views
|
6 Replies
|
4 Total Likes
View groups...
Share
Share this post:

Add lines to 3D Plot

Posted 11 years ago
How can I add lines that demarcate the different regions of the following 3D plot like [a > 0, c > 0], [a = 0, c > 0] etc.?
Plot3D[1/(1 + E^(-a - c)), {a, -8, 8}, {c, -8, 8}]

Thanks in advance!
6 Replies
You may find the follwing helpful.

(1) Drawing lines in 3D plots:
http://mathematica.stackexchange.com/questions/20479

(2) Various contour plot and marking planes inside 3D plots:
http://mathematica.stackexchange.com/search?q=planes+in+3D+plot
POSTED BY: Isaac Abraham
thanks for the references. I have looked at them but I still don't know how to solve the problem.

To give you an idea of what I have in mind I have added the lines in paint to the diagram. What I want to know is how to make something similar in mathematica directly.


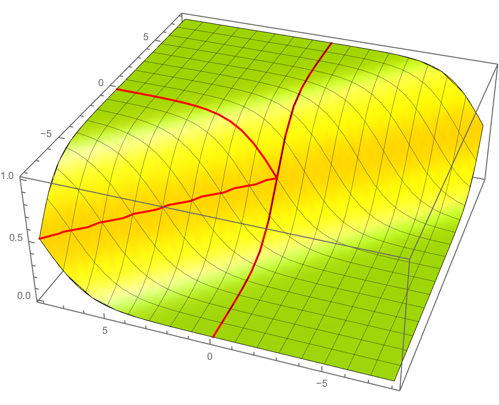
 pl1 = Plot3D[1/(1 + E^(-a - c)), {a, -8, 8}, {c, 0, 8},
    Mesh -> {{0}, {0}}, PlotStyle -> None,
    MeshStyle -> Directive[Thick, Red]];
 pl2 = Plot3D[1/(1 + E^(-a - c)), {a, -8, 8}, {c, 0, 8},
    MeshFunctions -> {#1 + #2 &}, Mesh -> {{0}, {0}},
    PlotStyle -> None, MeshStyle -> Directive[Thick, Red]];
 pl3 = Plot3D[1/(1 + E^(-a - c)), {a, -8, 8}, {c, -8, 8},
    Mesh -> {{0}, {0}}, MeshFunctions -> {#2 &}, PlotStyle -> None,
    MeshStyle -> Directive[Thick, Red]];
pl4 = Plot3D[1/(1 + E^(-a - c)), {a, -8, 8}, {c, -8, 8},
   PlotStyle -> Directive[Yellow, Specularity[White, 20]],
   MeshStyle -> Opacity[.5], PlotPoints -> 40];


Show[pl3, pl1, pl2, pl4]

POSTED BY: Vitaliy Kaurov
Another answer to the same question is cross-posted on MSE.
POSTED BY: Sam Carrettie
Thanks for the reply!

Sorry for crossposting (I did not anticipate that you would be so quick and effective in replying!)

Is it also possible to color the different regions?
Yes it is very easy for rectangular regions:

Plot3D[1/(1 + E^(-a - c)), {a, -8, 8}, {c, -8, 8}, Mesh -> {{0}, {0}},
  MeshStyle -> Directive[Thick, Gray],
MeshShading -> {{Yellow, Blue}, {Green, Red}}, PlotPoints -> 40]


But I am not sure about syntax for the custom regions. Maybe that MSE answer syntax is more suitable for that.
POSTED BY: Sam Carrettie
Reply to this discussion
Community posts can be styled and formatted using the Markdown syntax.
Reply Preview
Attachments
Remove
or Discard

Group Abstract Group Abstract