Introduction
After two mass shooting in two consecutive days in USA I wanted to make a quick analysis of mass shooting data. I found a website that collects this data from 1982 till July-2019.
https://www.motherjones.com/politics/2012/12/mass-shootings-mother-jones-full-data/
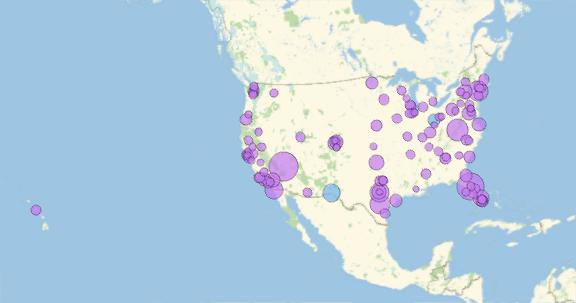
I was interested in number of fatalities, date and race. The cover image shows the locations of the incidents on the map of USA with disks sizes proportional to the number of fatalities with the latest two shootings highlighted in light blue.
Fatalities over time
Number of fatalities over time shows an increase in rate and number of fatalities over time specially in the last 10 years.
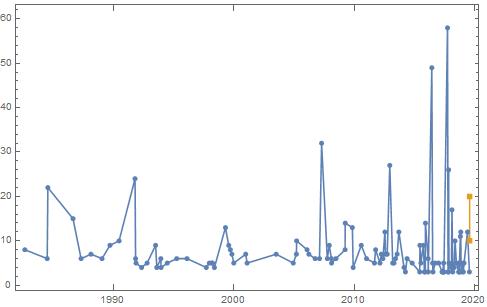
note that the orange entries represents the latest two shootings!
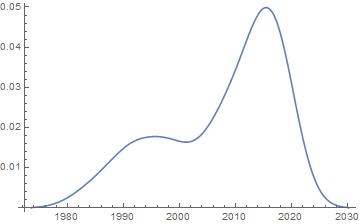
The Yearly rate of mass shooting is obviously high in recent years
Finding total number of fatalities per year after adding the two recent incidences support the same results.
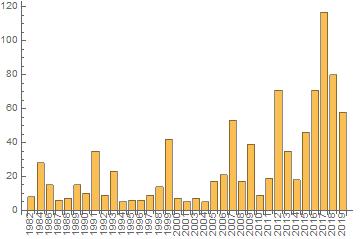
It also shows that the year 2017 has the highest number of fatalities as a result of mass shootings with total number of fatalities 117.
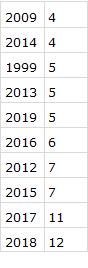
Also the top 10 years in terms of number of mass shootings are all in the last 10 years except 1999 as shown in the following table:-
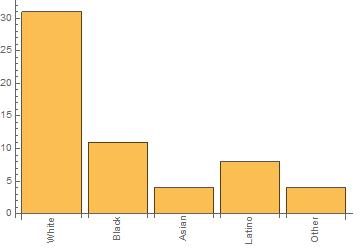
In these 10 years the shooters were mostly white in race!
Finally the notebook and data files are included for more analysis.
 Attachments:


