Message Boards Message Boards

1
|
9217 Views
|
2 Replies
|
5 Total Likes
View groups...
Share
Share this post:

Map points on a square to a Torus, and plot.

Posted 11 years ago
Hello All!

I wonder if someone could please help. I wish to map points on a square onto a torus. I wonder if there is a quickish way to do this in Mathematica? To generate a square with points, I use the following code:
squareGridSize = 100;

numberPoints = 50;
positionList = RandomReal[{0, squareGridSize}, {numberPoints, 2}];
ListPlot[positionList, PlotRange -> {{0, squareGridSize}, {0, squareGridSize}}]
This generates a square of dimensions 100x100 units, with 50 random points within. This is also plotted.

I wonder if these points can be mapped on to the surface of a torus? I understand from the following that this cannot be done in a manner which preserves distance:
http://www.gipsa-lab.fr/~francis.lazarus/Hevea/Presse/index-en.html

However for the purpose of a quick illustration, I wonder if the mapping is possible, despite not being isometric in the final visualization?

This link may also be useful, though it does not show how to map points on to a surface, but a contour.
http://mathematica.stackexchange.com/questions/26749/plotting-a-contour-on-a-torus

Cheers! 
Priyan.
POSTED BY: Priyan Fernando
2 Replies
Posted 11 years ago
Thanks Shenghui.

This is the mapping I was looking for! And thanks for the code!

Much appreciated,
Priyan.
POSTED BY: Priyan Fernando
You can use the straightforward method to handle this problem. Basically, you map the {0,100} by {0,100} domain to {0,2 Pi} domain. Add some radius info to adjust the looking of the torus. Here is an example
dataTorus = positionList/100*2 \[Pi] (* positionList is from your code*)
Assume the radius of the ring is r1 and the radius of the tube is r2. Use the parameterized coordinates, we have
r1=1;r2=0.3;
f[{\[Theta]_,\[Phi]_}]:={(r1+r2*Cos[\[Phi]])*Cos[\[Theta]],(r1+r2*Cos[\[Phi]])*Sin[\[Theta]],r2*Sin[\[Phi]]}
(* Phi is the (Pi/2 - polar angle) and Theta is the azimuth angle*)
The coordinate conversion is simply
Evaluate[f] /@ dataTorus
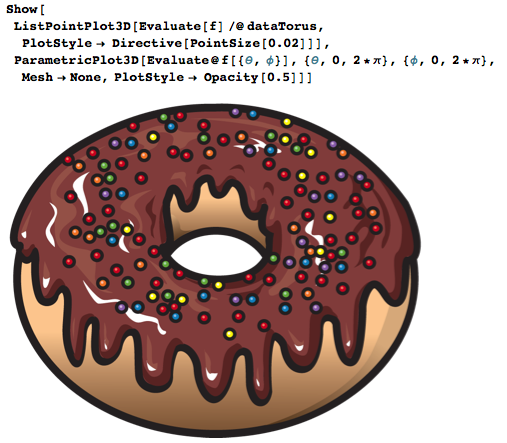
Use Show function as chocolate to glue the doughnut and sprinkles together:
Show[
ListPointPlot3D[Evaluate[f] /@ dataTorus,PlotStyle -> Directive[PointSize[0.02]]], 
ParametricPlot3D[Evaluate@f[{\[Theta], \[Phi]}], {\[Theta], 0, 2*\[Pi]}, {\[Phi], 0, 2*\[Pi]}, Mesh -> None, PlotStyle -> Opacity[0.5]]]

POSTED BY: Shenghui Yang
Reply to this discussion
Community posts can be styled and formatted using the Markdown syntax.
Reply Preview
Attachments
Remove
or Discard

Group Abstract Group Abstract