Group Abstract Group Abstract

Message Boards Message Boards

0
|
3.7K Views
|
5 Replies
|
3 Total Likes
View groups...
Share
Share this post:

[?] Plot and set legends for these curves?

Posted 6 years ago

How do plot (or set) a legend for the 2 curves of this plot ? Thanks for your support.

Plot[Table[-(10/\[CapitalDelta]t)*
   Log[\[CapitalDelta]P], {\[CapitalDelta]P, {2, 
    4}}], {\[CapitalDelta]t, 1, 60}, PlotLegends -> "Automatic"]
POSTED BY: Christoph Frei
5 Replies

Hey, Christoph, how are you? The following code (Evaluate) do the trick

Plot[Evaluate[Table[-(10/t)*Log[P], {P, {2, 4}}]], {t, 1, 60},
 PlotLegends -> {"One", "Two"}]

enter image description here

Hope that it is what you wanted. See you.

POSTED BY: Estevao Teixeira
Posted 6 years ago

Thanks a lot for your support Estevao. Plot appears now exactly as I want. Great. Cheers,

POSTED BY: Christoph Frei

You could also plot it using the Plot3D function. You will be able to see it better

Plot3D[-(10/t)*Log[P],{P,2,4},{t,1,60},PlotLegends->{"Function"},AxesLabel->{"P","t","f(p,t)"}]

result:

enter image description here

POSTED BY: Estevao Teixeira

In this case, you want to evaluate the Table first and then you need the variable t to plot it. The Evaluate function will run it without t and then the plot function will apply t on it. It is like, Evaluate will hold the equation with a variable (without a numerical result). You can check the documentation: http://reference.wolfram.com/language/ref/Evaluate.html

In the LogPlot case, your function is not helping :).. So, i changed the minus sign to show you that it also works.

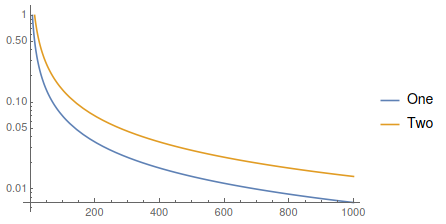
y = Table[(10/t)*Log[P], {P, {2, 4}}]
LogPlot[Evaluate@y,{t,1,1000},PlotLegends->{"One","Two"}]

and the result is

enter image description here

POSTED BY: Estevao Teixeira
Posted 6 years ago

Perfect, Thanks a lot, Estevao. I have always difficulty to find the proper command in Mathematica. How can we know one needs to use this command/function in this case?

And one more issue why it does not work with LogPlot: LogPlot[Evaluate[Table[-(10/t)*Log[P], {P, {2, 4}}]], {t, 1, 60}, PlotLegends -> {"One", "Two"}]

POSTED BY: Christoph Frei
Reply to this discussion
Community posts can be styled and formatted using the Markdown syntax.
Reply Preview
Attachments
Remove
or Discard