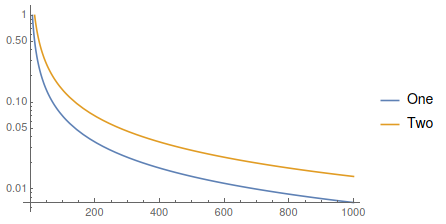
In this case, you want to evaluate the Table first and then you need the variable t to plot it. The Evaluate function will run it without t and then the plot function will apply t on it. It is like, Evaluate will hold the equation with a variable (without a numerical result). You can check the documentation: http://reference.wolfram.com/language/ref/Evaluate.html
In the LogPlot case, your function is not helping :).. So, i changed the minus sign to show you that it also works.
y = Table[(10/t)*Log[P], {P, {2, 4}}]
LogPlot[Evaluate@y,{t,1,1000},PlotLegends->{"One","Two"}]
and the result is
