PART 1 - Parsing the data
I was working with the AME2016 data and I decided to curate the data in order to insert it in the Wolfram Data Repository.
Introduction
The brief description of the data is:
As a fundamental property of nuclei, atomic masses are widely used in many domains of science and engineering. A reliable atomic mass table derived from the experimental data, where the atomic masses and the relevant experimental information can be found conveniently, is in high demand by the research community. To meet the demands, the Atomic Mass Evaluation (Ame) was created in 1950's and now serves the research community by providing the most reliable and comprehensive information related to the atomic masses. (G. Audi, Int. J. Mass Spectr.251: 85 (2006) http://dx.doi.org/10.1016/j.ijms.2006.01.04)
This data represents the newest published one in 2016. It is called AME2016.
The data represents: Atomic mass list for analysis. This list contains the elements, mass excess, binding energy, beta-decay energy, atomic mass and more.
The data itself can be found at Atomic Mass Data Center (AMDC) website: http://amdc.impcas.ac.cn/index.html | http://amdc.impcas.ac.cn/web/masseval.html
The data looks like this 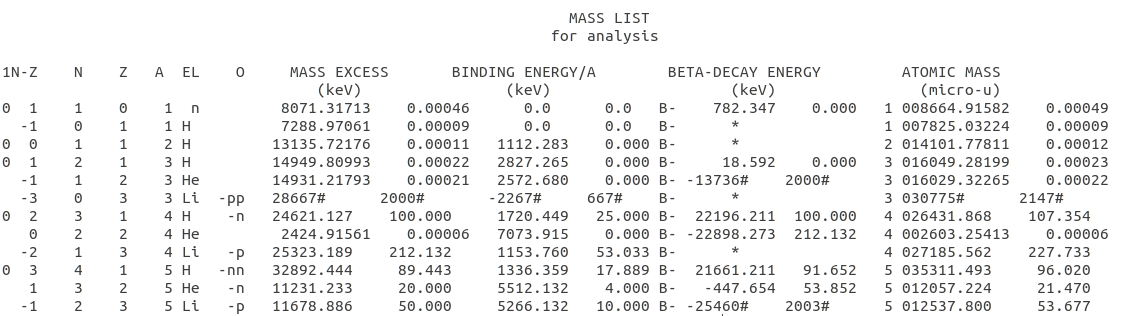 a file with 3426 lines of Atomic mass data. The txt file has 39 lines as header and every line of data has 124 characters. All this information is found in the data file.
Importing the data file
First of all, I import the file without the headers
SetDirectory@NotebookDirectory[];
rawData = Import["mass16.dat", "Lines"][[40 ;;]];
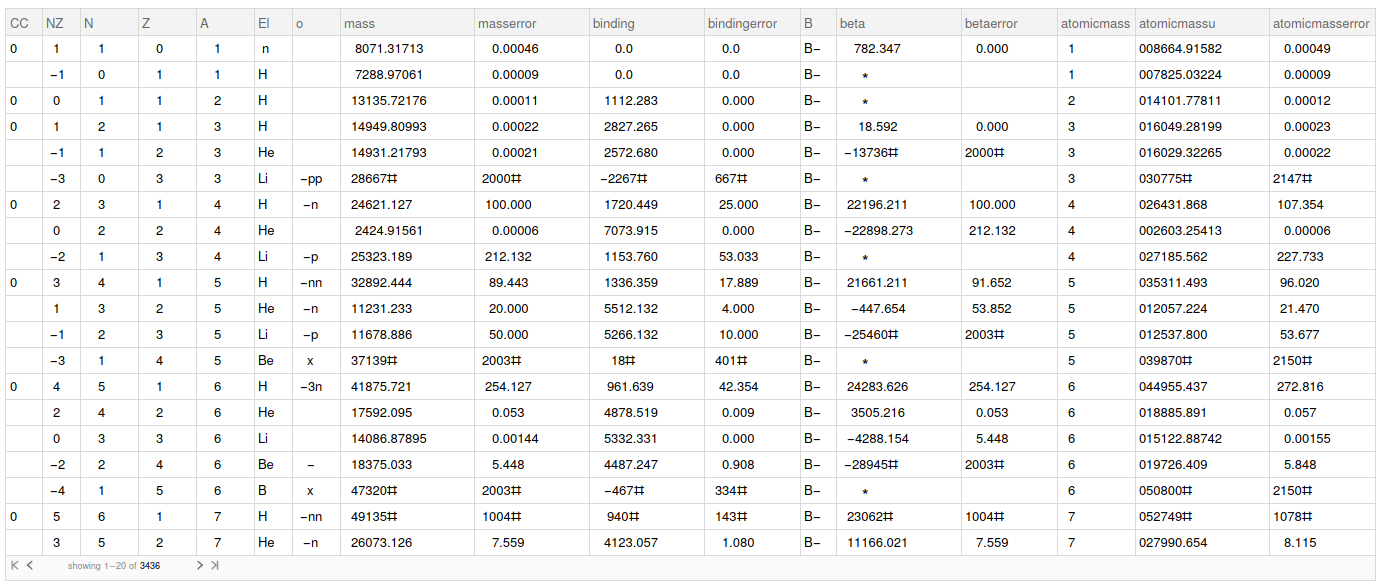
Parsing the data file to a dataset
Using the format defined by the article authors, we now how to work in each line of the file. Let's parse the file to a dataset.
parsedData = Map[
    <|
      "CC" -> StringTake[#, {1, 1}],
      "NZ" -> StringTake[#, {2, 4}],
      "N" -> StringTake[#, {5, 9}],
      "Z" -> StringTake[#, {10, 14}],
      "A" -> StringTake[#, {15, 19}],
      "El" -> StringTake[#, {21, 23}],
      "o" -> StringTake[#, {24, 27}],
      "mass" -> StringTake[#, {29, 41}],
      "masserror" -> StringTake[#, {42, 52}],
      "binding" -> StringTake[#, {53, 63}],
      "bindingerror" -> StringTake[#, {64, 72}],
      "B" -> StringTake[#, {74, 75}],
      "beta" -> StringTake[#, {76, 87}],
      "betaerror" -> StringTake[#, {88, 96}],
      "atomicmass" -> StringTake[#, {97, 100}],
      "atomicmassu" -> StringTake[#, {101, 113}],
      "atomicmasserror" -> StringTake[#, {114, UpTo[124]}]
      |> &
    , rawData] // Dataset;
Data cleaning
Now, we have to clean it and make it searchable.
Cleaning whitespaces
We remove all whitespaces in every fields.
cleanData =
  Map[Map[If[StringLength[x = StringReplace[#, Whitespace -> ""]] < 1,
        Missing[], x] &, #] &, parsedData];
Helper functions
These functions will help us in the cleaning process. For example, in the data, the authors defined the character "*" to represent a "non-experimental" value. We will find these characters and fix other values.
The "clearNonExperimentalSign" removes "#" or "*" from a string
clearNonExperimentalSign[s_String] := StringReplace[s,("#"|"*")-> ""];
The "clearNotMissing" parses all the info that are not missing
clearNotMissing[v_,unit_String,fixvalue_] := If[MissingQ@v,v,valueToQuantity[clearNonExperimentalSign@v,unit,fixvalue]];
The "matchNonExperimentalSign" finds all "#" characters and return if it is a "non-experimental" or "experimental" value.
matchNonExperimentalSign[s_String] := If[StringMatchQ[s,___~~"#"~~___],"non-experimental","experimental"];
And finally, the "valueToQuantity" transform any possible value to a WL Quantity.
valueToQuantity[s_,unit_String,fixvalue_] := If[NumberQ[ToExpression@s ],N@Quantity[ToExpression@s* fixvalue,unit],s]
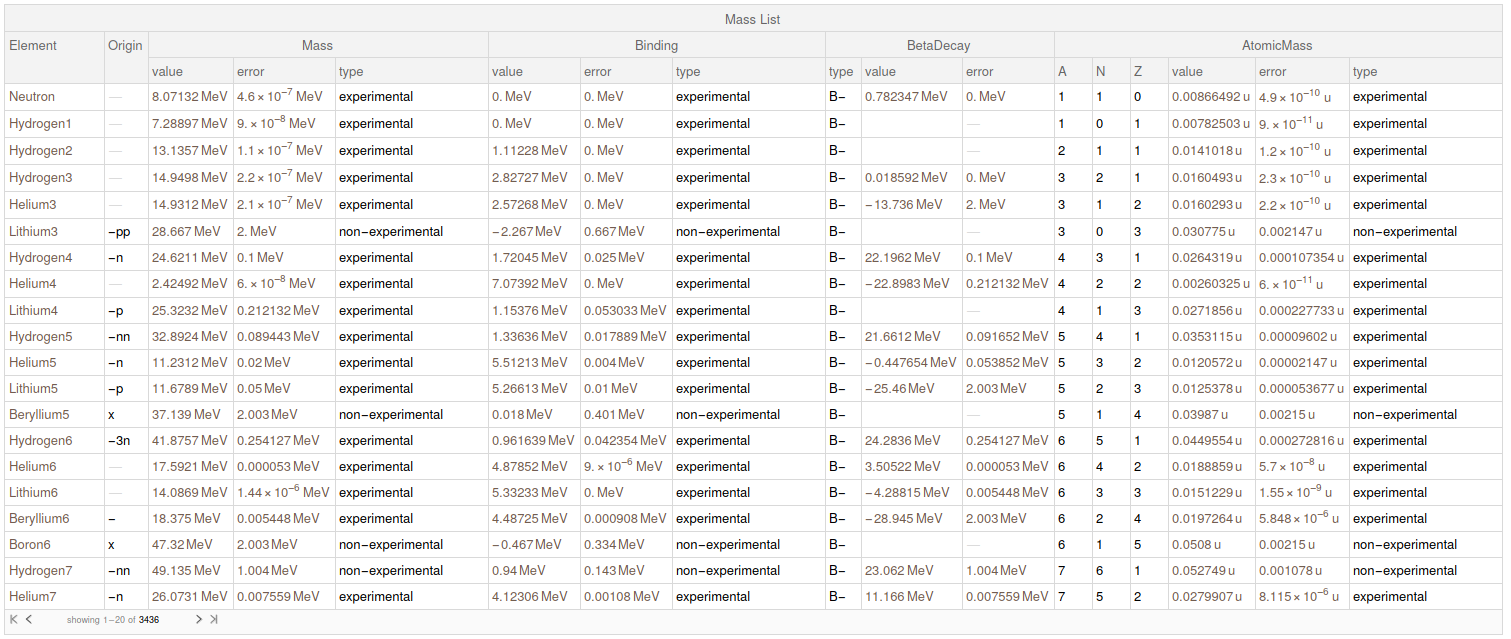
Final and parsed dataset
Now, we parse all the previous data to a final dataset with all the information parsed.
finalData = Map[
   <|
     "Mass List" -> <|
        "Element" -> Quiet[IsotopeData[{ToExpression@#[["Z"]], ToExpression@#[["A"]]}]] /. _IsotopeData -> #[["El"]] <> #[["A"]],
       "Origin" -> #[["o"]],
       "Mass" -> <|
          "value" -> valueToQuantity[clearNonExperimentalSign@#[["mass"]], "MeV", 10^-3],
         "error" -> valueToQuantity[clearNonExperimentalSign@#[["masserror"]], "MeV", 10^-3],
          "type" -> matchNonExperimentalSign@#[["mass"]]
         |>,
       "Binding" ->
        <|
         "value" -> valueToQuantity[clearNonExperimentalSign@#[["binding"]], "MeV", 10^-3],
         "error" -> valueToQuantity[clearNonExperimentalSign@#[["bindingerror"]], "MeV", 10^-3],
         "type" -> matchNonExperimentalSign@#[["binding"]]
         |>,
       "BetaDecay" ->
        <|
         "type" -> #[["B"]],
         "value" -> clearNotMissing[#[["beta"]], "MeV", 10^-3],
         "error" -> clearNotMissing[#[["betaerror"]], "MeV", 10^-3]
         |>,
       "AtomicMass" ->
        <|
         "A" -> #[["atomicmass"]],
         "N" -> #[["N"]],
         "Z" -> #[["Z"]],
         "value" -> valueToQuantity[clearNonExperimentalSign@#[["atomicmassu"]], "u", 10^-6],
         "error" -> valueToQuantity[clearNonExperimentalSign@#[["atomicmasserror"]], "u", 10^-6],
         "type" -> matchNonExperimentalSign@#[["atomicmassu"]]
         |>
       |>
     |>
    &, cleanData
   ];

   finalData
I submitted this data for the Wolfram Data Repository. When they give me a link I will update this post with it.
The next part of this post is to compare this dataset with the data in Wolfram Language.
PART 2 - Comparing with WL
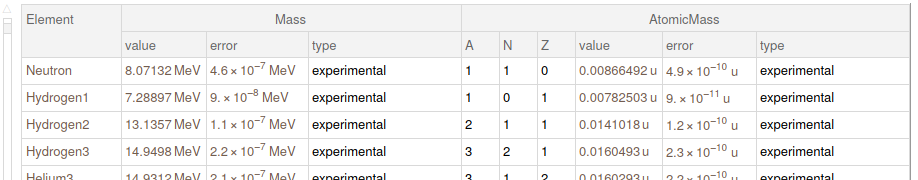
In the last text we got the parsed dataset. Here, I reduce it to work just with some fields
elementMasses = finalData[All, 1, {"Element", "Mass", "AtomicMass"}]
Ideas
Wolfram Language (WL) has a function called IsotopeData. One can retrieve a lot of information about isotopes. One of the information that we will try to compare is the mass excess. Let`s see the difference between the last published data and the data in WL.
Comparing the MassExcess value column with the data in Wolfram Language.
To plot, we need still less information. Because of that, we create the following variable
ReducedData = finalData[All,
   1, {"Element", "MassExcess", "AtomicMass"}];
ExampleListToPlot = {#Element,
     ToExpression@#AtomicMass[["N"]], #MassExcess[["Value"]]} & /@
   ReducedData[[2 ;;]];
Then, we create a new list with those elements that are not in WL
MissingElmentsInWL =
  Query[Select[StringQ[#["Element"]] &]] @ ReducedData[2 ;;];
ListMissingElementsWL = {#Element,
     ToExpression@#AtomicMass[["N"]], #MassExcess[["Value"]]} & /@
   MissingElmentsInWL;
Now, we plot all the Mass Excess from All elements. The blue dots are the elements in this data resource, the red ones are the ones missing in WL.
ListPlot[{ExampleListToPlot[[All, {2, 3}]],
  ListMissingElementsWL[[All, {2, 3}]]}, PlotRange -> All,
 PlotStyle -> {{}, {Red}},
 AxesLabel -> {"N (Neutrons)", "Mass excess (MeV)"},
 PlotLegends -> {"Isotopes in both Data Resource and WL",
   "Missing Isotopes in WL"}, ImageSize -> 600]
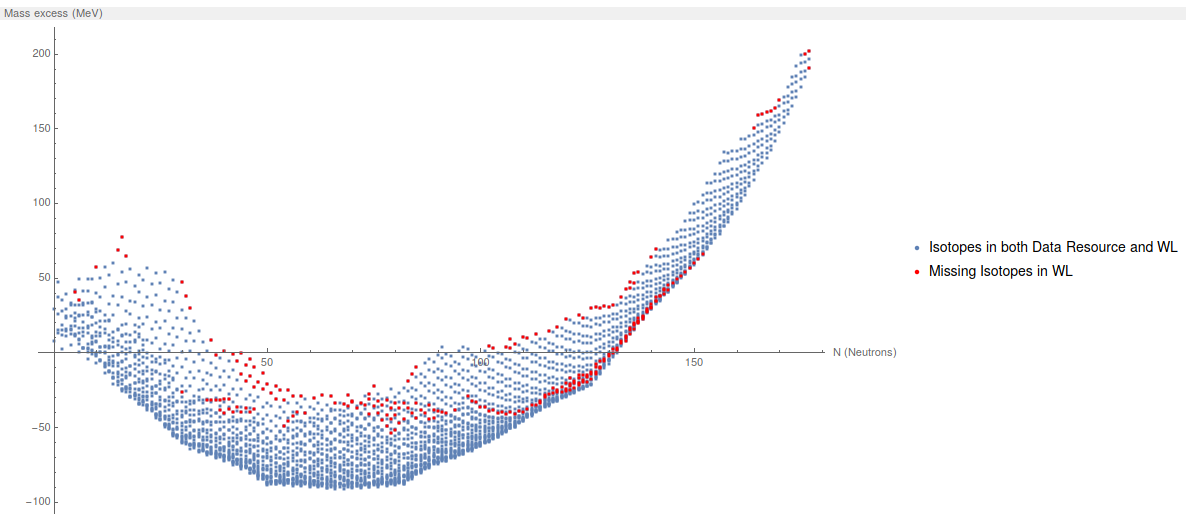
The first conclusion: There is 253 isotopes missing in Wolfram language.
Difference between the mass excess in both data
Now, I wanted to check the difference between the data in each resource.
I will create two list, one with the isotopes in the AME2016 data and the other with the isotopes that are in WL
articleCleanDataset =
Query[Select[Not@StringQ[#["Element"]] &]] @ ReducedData[2 ;;];
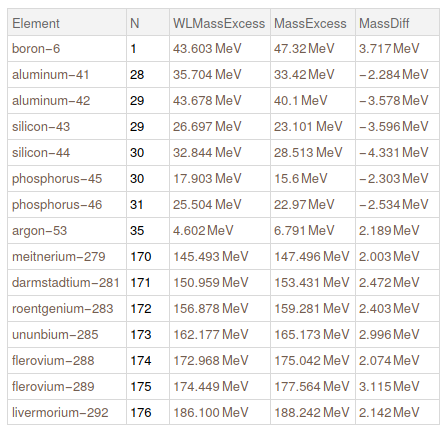
mathematicaData = <| "Element" -> #Element,
"N" -> ToExpression@#AtomicMass[["N"]],
"WLMassExcess" -> #Element["MassExcess"],
"MassExcess" -> #Mass[["value"]],
"MassDiff" -> #Mass[["value"]] - #Element["MassExcess"] |> & /@
articleCleanDataset
Lets get the cases where we have a huge difference between our data and WL data. Lets show the ones that are higher than 2 MeV
Query[Select[Abs@#MassDiff > Quantity[2, "MeV"] & ]] @ mathematicaData
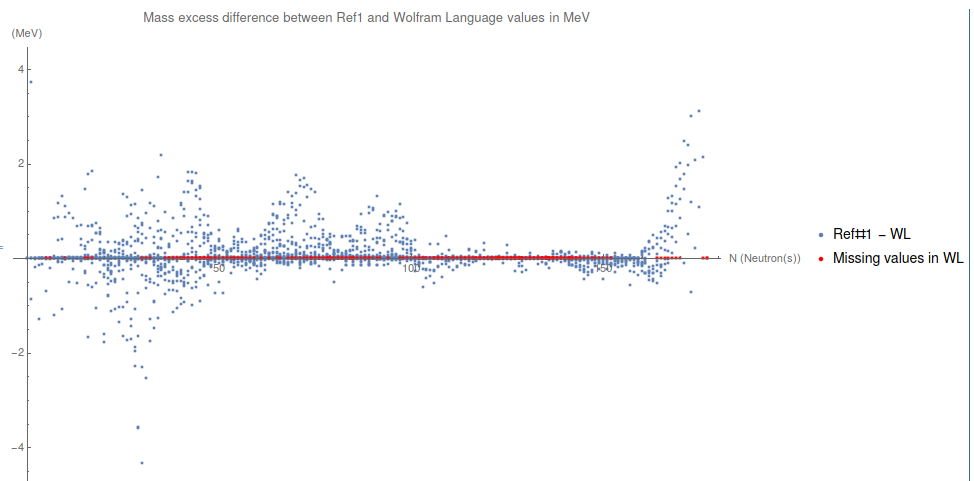
Then, we replace all missing isotopes in WL as if they have zero mass
listMissingElementsToPlot = {#[[2]], Quantity[0, "MeV"]} & /@
   ListMissingElementsWL;
and we plot it
plotDifferenceBetweenMasses =
 ListPlot[{mathematicaData[[All, {2, 5}]],
   listMissingElementsToPlot},
  PlotRange -> All, PlotStyle -> {{}, {Red, PointSize[0.004]}},
   AxesLabel -> {"N (Neutron(s))", "(MeV)"},
  PlotLabel ->
   "Mass excess difference between Ref1 and Wolfram Language values \
in MeV",
  PlotLegends -> {"Ref#1 - WL", "Missing values in WL"},
  ImageSize -> 1000 ]
Conclusions
I did this "mini-study" to compare the newest data in the area with the values provided by the Wolfram Language. One could see that WL needs to update their data. It is useful to play with it but it is not the good one to work with.
I searched in their documentation and they say that the most recent data is from 2007. The data that I worked in this post is from 2016, the most recent one. The next data is expected to be released in 2022.
In conclusion, It would be great if WL has the most recent values to work with.
I hope that you had enjoyed the post. Thanks.


