Greetings everyone,
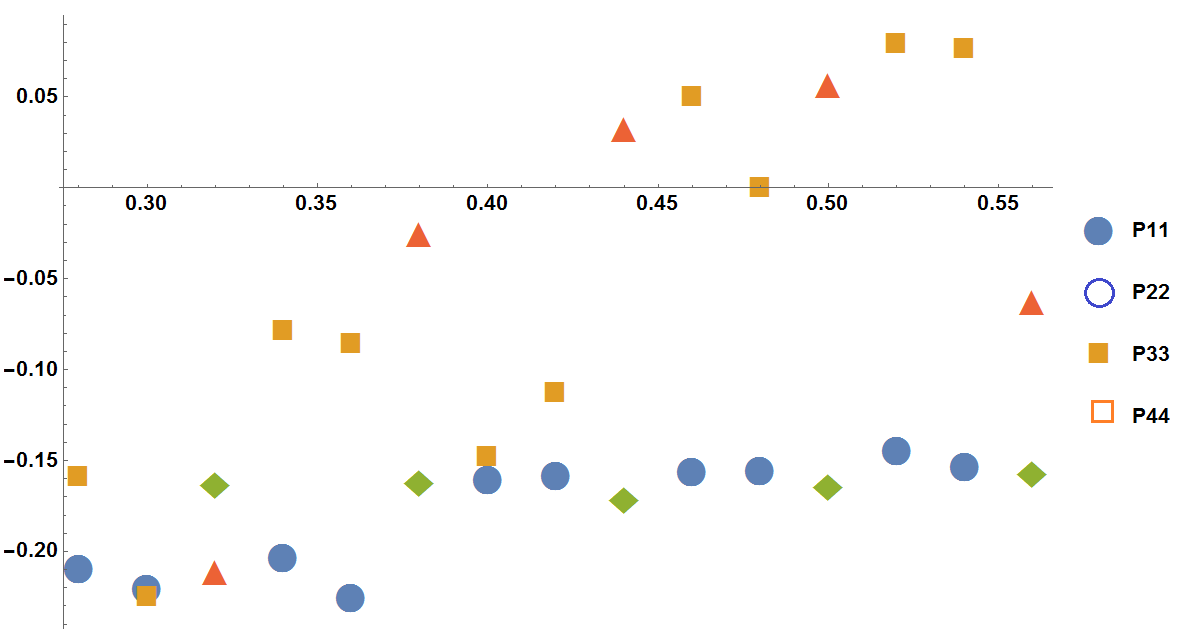
I am trying to show the legend as a filled and empty circle and square markers. How do I do that?
    X1 = {0.28, 0.3, 0.34, 0.36, 0.4, 0.42, 0.46, 0.48, 0.52, 0.54};
    Y1 = {-0.209, -0.220, -0.203, -0.225, -0.160, -0.158, -0.156, -0.155, -0.144, -0.153};
    Y2 = {-0.160, -0.226, -0.080, -0.087, -0.149, -0.114, 0.049, -0.001, 0.078, 0.075};
    X2 = {0.32, 0.38, 0.44, 0.5, 0.56};
    Y3 = {-0.163, -0.162`, -0.171, -0.164, -0.157};
    Y4 = {-0.211, -0.025, 0.033, 0.057, -0.062};
    ListPlot[{Transpose[{X1, Y1}], Transpose[{X1, Y2}],
  Transpose[{X2, Y3}], Transpose[{X2, Y4}]},
 PlotLegends -> {P11, P22, P33, P44}, PlotMarkers -> {Automatic, 30},
 ImageSize -> 700, LabelStyle -> {14, GrayLevel[0], Bold},
 PlotRange -> All]

Thanks in advance.