Group Abstract Group Abstract

Message Boards Message Boards

0
|
7.3K Views
|
6 Replies
|
4 Total Likes
View groups...
Share
Share this post:

Show legends as a filled & empty circle & square markers using PlotMarkers?

Greetings everyone,

I am trying to show the legend as a filled and empty circle and square markers. How do I do that?

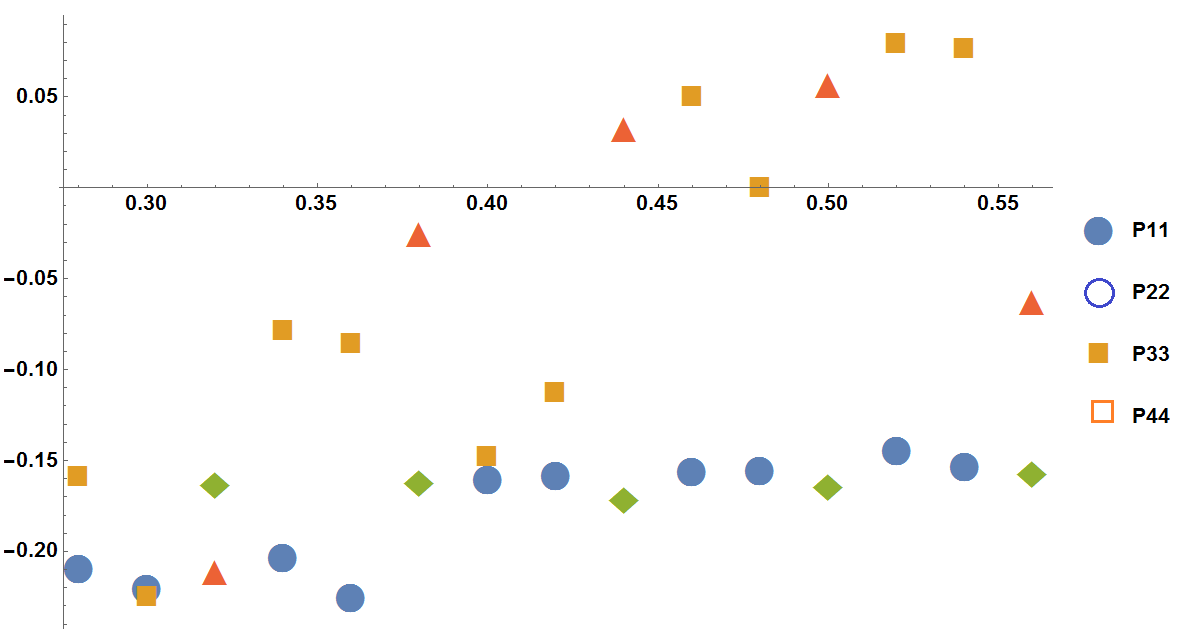
    X1 = {0.28, 0.3, 0.34, 0.36, 0.4, 0.42, 0.46, 0.48, 0.52, 0.54};
    Y1 = {-0.209, -0.220, -0.203, -0.225, -0.160, -0.158, -0.156, -0.155, -0.144, -0.153};
    Y2 = {-0.160, -0.226, -0.080, -0.087, -0.149, -0.114, 0.049, -0.001, 0.078, 0.075};
    X2 = {0.32, 0.38, 0.44, 0.5, 0.56};
    Y3 = {-0.163, -0.162`, -0.171, -0.164, -0.157};
    Y4 = {-0.211, -0.025, 0.033, 0.057, -0.062};
    ListPlot[{Transpose[{X1, Y1}], Transpose[{X1, Y2}], 
  Transpose[{X2, Y3}], Transpose[{X2, Y4}]}, 
 PlotLegends -> {P11, P22, P33, P44}, PlotMarkers -> {Automatic, 30}, 
 ImageSize -> 700, LabelStyle -> {14, GrayLevel[0], Bold}, 
 PlotRange -> All]

enter image description here

Thanks in advance.

POSTED BY: M.A. Ghorbani
6 Replies

Thanks again, Rohit :)

POSTED BY: M.A. Ghorbani
Posted 6 years ago

Hi there,

Parenthesis are misplaced and there is no EmptyRightTriangle. Try this instead.

PlotMarkers -> {{\[FilledCircle], 20}, {\[FilledSquare], 20},
  {\[FilledUpTriangle], 20}, {\[FilledDiamond], 20},
  {\[EmptyCircle], 20}, {\[EmptySquare], 20},
  {\[EmptyUpTriangle], 20}, {\[EmptyDiamond], 20}}
POSTED BY: Rohit Namjoshi

Rohit,

Thank you so much. Could please have a look at the attached notebook. I deeply appreciate your help.

Attachments:
POSTED BY: M.A. Ghorbani

Dear Estevao,

Thank so much. I did your mentioned explains for my original data, but I couldn't get the expected plot. Please see the enclosed file.

Attachments:
POSTED BY: M.A. Ghorbani
Posted 6 years ago

Instead of Automatic specify the marker and size. e.g.

ListPlot[{Transpose[{X1, Y1}], Transpose[{X1, Y2}], 
  Transpose[{X2, Y3}], Transpose[{X2, Y4}]}, 
 PlotLegends -> {P11, P22, P33, P44}, 
 PlotMarkers -> {{"\[FilledSquare]", 30}, {"\[FilledCircle]", 
    30}, {"\[EmptySquare]", 30}, {"\[EmptyCircle]", 30}},  
 ImageSize -> 700, LabelStyle -> {14, GrayLevel[0], Bold}, 
 PlotRange -> All]

enter image description here

POSTED BY: Rohit Namjoshi

Hey, M.A. Ghorbani, how are you?

You can check the symbols page https://reference.wolfram.com/language/guide/ShapesIconsAndRelatedCharacters.html and copy the ones that you want to insert in your plot.

I did one example changing the PlotMarkers and PlotStyle options

ListPlot[{Transpose[{X1, Y1}], Transpose[{X1, Y2}], 
  Transpose[{X2, Y3}], Transpose[{X2, Y4}]}, 
 PlotLegends -> {P11, P22, P33, P44},
 PlotMarkers -> {{\[FilledCircle], 20}, {\[EmptyCircle], 
    20}, {\[FilledSquare], 20}, {\[EmptySquare], 20}}, 
 PlotStyle -> {Automatic, Blue, Orange, Orange},
 ImageSize -> 700, LabelStyle -> {14, GrayLevel[0], Bold}, 
 PlotRange -> All]

The result is

enter image description here

POSTED BY: Estevao Teixeira
Reply to this discussion
Community posts can be styled and formatted using the Markdown syntax.
Reply Preview
Attachments
Remove
or Discard