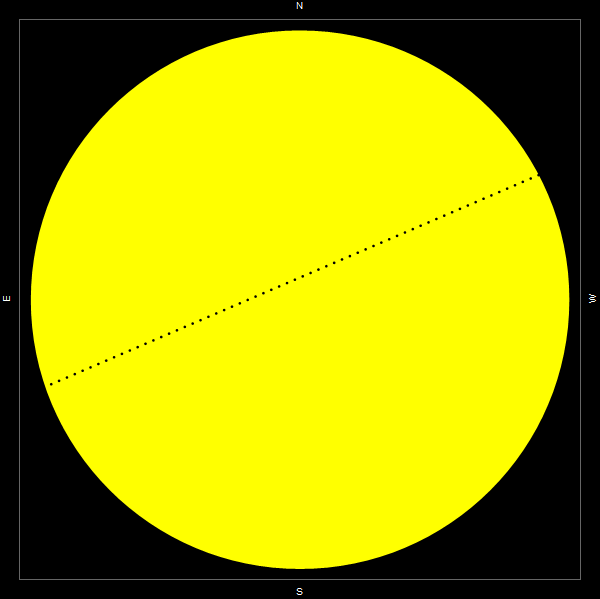
On November 11, 2019, the planet Mercury will transit across the face of the Sun. If you have a suitably designed telescope or other observing apparatus for observing the Sun (check with your local astronomy club), you can watch a tiny black dot move across the face of the Sun. I used Wolfram Language to simulate what you might see.
The entire event will last about 5.5 hours:
start = DateObject[{2019, 11, 11, 7, 35, 27}, TimeZone -> -5];

end = DateObject[{2019, 11, 11, 13, 4, 14}, TimeZone -> -5];

dd = DateDifference[start, end];
This corresponds to a little less than 5.5 hours.
In[4]:= UnitConvert[dd, "Hours"]

Out[4]= Quantity[5.47972, "Hours"]
The angular radius of the Sun and Mercury are needed to have a realistic simulation ("AngularRadiusFromEarth", and "AngularDiameterFromEarth" for Star entities coming soon).
sunradius = .5383/2;

mercuryradius =
  QuantityMagnitude[
   Entity["Planet", "Mercury"][
     Dated["AngularDiameterFromEarth", start]]/2, "AngularDegrees"];
Next I define a list of dates, from the start to end of the event, at 5 minute increments:
dates = DateRange[start, end, Quantity[5, "Minutes"]];
Both the Sun and Mercury move during the course of the event so we need lists of their positions as time progresses.
sunpos = {-1, 1}*# & /@
   QuantityMagnitude[
     SunPosition[dates, CelestialSystem -> "Equatorial"],
     "AngularDegrees"]["Values"];

mercpos = {-1, 1}*# & /@
   QuantityMagnitude[
    Transpose[{Entity["Planet", "Mercury"][
       Dated["RightAscension", #] & /@ dates],
      Entity["Planet", "Mercury"][
       Dated["Declination", #] & /@ dates]}], "AngularDegrees"];
Finally, we can plot the position of both objects using the following showing Mercury advancing across the Sun's visible disk.
Graphics[{Yellow, Disk[{0, 0}, sunradius], Black,
  Disk[#, mercuryradius] & /@ (mercpos - sunpos)}, ImageSize -> 600,
 Frame -> True, FrameTicks -> None,
 FrameLabel -> {"S", "E", "N", "W"}, Background -> Black,
 LabelStyle -> {White}]
This will make the graphics shown at the top of the post.