Hi Tsai,
It is unfortunate that WL has no built-in way to do this as far as I know. Here is one workaround.
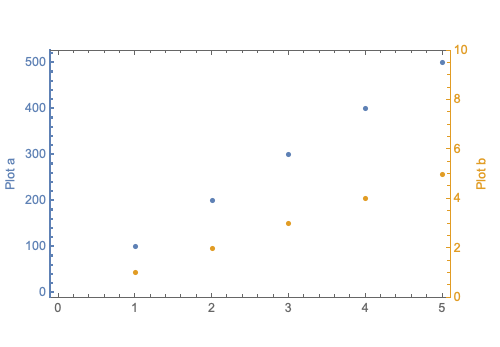
plot1 = ListPlot[a,
   ImageSize -> 400,
   ImagePadding -> 40,
   PlotStyle -> ColorData[97][1],
   Frame -> {True, True, True, False},
   FrameStyle -> {Automatic, ColorData[97][1], Automatic, Automatic},
   FrameLabel -> {{"Plot a", None}, {None, None}}];

plot2 = ListPlot[b,
   ImageSize -> 400,
   ImagePadding -> 40,
   PlotRange -> {0, 10},
   PlotStyle -> ColorData[97][2],
   Frame -> {False, False, False, True},
   FrameStyle -> {Automatic, Automatic, Automatic, ColorData[97][2]},
   FrameTicks -> {{False, All}, {False, False}},
   FrameLabel -> {{None, "Plot b"}, {None, None}}];

Overlay[{plot1, plot2}]