Hello everyone.
I have two sets of data constructed using Transpose@{...}; they are two representations of a variable against time in two circunstances. I want to plot them together, but the resulting image looks like fig1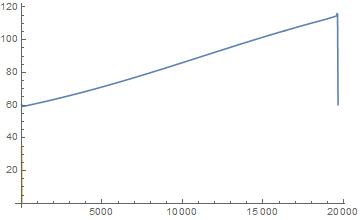 . I don't know why this happens. I am attaching the .txt files with the data and time in case someone can help me. What I have done to construct the image is ListPlot[{data1, data2}, Joined -> True]
Thanks for reading. Jaime.
 Attachments:


