Group Abstract Group Abstract

Message Boards Message Boards

[?] Plot two lists together in same ListPlot?

Posted 5 years ago

Hello everyone.

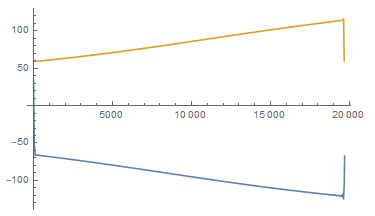
I have two sets of data constructed using Transpose@{...}; they are two representations of a variable against time in two circunstances. I want to plot them together, but the resulting image looks like fig1enter image description here. I don't know why this happens. I am attaching the .txt files with the data and time in case someone can help me. What I have done to construct the image is ListPlot[{data1, data2}, Joined -> True]

Thanks for reading. Jaime.

Attachments:
POSTED BY: Jaime de la Mota
7 Replies
Posted 5 years ago

it is very cool for me

POSTED BY: Vlad Burim

It works fine. Thank you very much

POSTED BY: Jaime de la Mota

It works fine. Thank you very much

POSTED BY: Jaime de la Mota
Posted 5 years ago

Try the option PlotRange->All

ListPlot[{data1, data2}, Joined -> True, PlotRange -> All]

enter image description here

POSTED BY: Hans Milton
Posted 5 years ago

The ListPlot command choosses the axis ranges automatically and drops your data. Try to add: PlotRange -> All

Succes.

POSTED BY: Wiel Aerts

Hello Neil.

I think I might have expressed myself wrong. data1 and data2 are the transposed data against time. That is what I am sending to ListPlot as you suggest, but as you can see, data1, the orange, is displayed at the bottom-left corner of the image.

Thanks anyways for the answer.

Jaime.

Attachment

Attachments:
POSTED BY: Jaime de la Mota

Jaime,

Don’t transpose when you already have x,y pairs

Do

ListPlot[{data1, data2}]

The documentation has good examples of this. (Look at 6th example under Scope).

Regards

Neil

POSTED BY: Neil Singer
Reply to this discussion
Community posts can be styled and formatted using the Markdown syntax.
Reply Preview
Attachments
Remove
or Discard